Microsoft 2015 Annual Report Download - page 25
Download and view the complete annual report
Please find page 25 of the 2015 Microsoft annual report below. You can navigate through the pages in the report by either clicking on the pages listed below, or by using the keyword search tool below to find specific information within the annual report.-
 1
1 -
2
-
3
-
4
-
5
-
6
-
7
-
8
-
9
-
10
-
11
-
12
-
13
-
14
-
 15
15 -
 16
16 -
 17
17 -
 18
18 -
 19
19 -
 20
20 -
 21
21 -
 22
22 -
 23
23 -
 24
24 -
 25
25 -
 26
26 -
 27
27 -
 28
28 -
 29
29 -
 30
30 -
 31
31 -
 32
32 -
 33
33 -
 34
34 -
 35
35 -
36
-
37
-
38
-
39
-
40
-
41
-
42
-
43
-
44
-
45
-
46
-
47
-
48
-
49
-
50
-
51
-
52
-
53
-
54
-
55
-
56
-
57
-
58
-
59
-
60
-
61
-
62
-
63
-
64
-
65
-
66
-
67
-
68
-
69
-
70
-
71
-
72
-
73
-
74
-
75
-
76
-
77
-
78
-
79
-
80
-
81
-
82
-
83
-
84
-
85
-
86
-
87
-
88
-
89
 |
 |

24
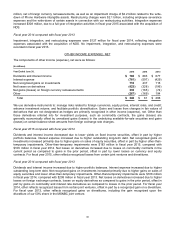
SEGMENT RESULTS OF OPERATIONS
Devices and Consumer
(In millions, except percentages) 2015 2014 2013
Percentage
Change 2015
Versus 2014
Percentage
Change 2014
Versus 2013
Revenue
Licensing $ 14,969 $ 19,528 $ 19,427 (23)% 1%
Hardware:
Computing and Gaming Hardware 10,183 9,093 6,149 12% 48%
Phone Hardware 7,524 1,982 0 * *
Total Devices and Consumer Hardware 17,707 11,075 6,149 60% 80%
Other 8,825 7,014 6,431 26% 9%
Total Devices and Consumer
revenue $41,501 $37,617 $32,007 10% 18%
Gross Margin
Licensing $13,870 $17,439 $16,985 (20)% 3%
Hardware:
Computing and Gaming Hardware 1,788 892 956 100% (7)%
Phone Hardware 701 54 0 * *
Total Devices and Consumer Hardware 2,489 946 956 163% (1)%
Other 2,022 1,393 1,951 45% (29)%
Total Devices and Consumer
gross margin $18,381 $19,778 $19,892 (7)% (1)%
* Not meaningful
Fiscal year 2015 compared with fiscal year 2014
D&C revenue increased $3.9 billion or 10%, primarily due to a full year of Phone Hardware sales, as well as higher
revenue from Surface, search advertising, and Xbox Live transactions, offset in part by a decrease in revenue from
Windows OEM, licensing of Windows Phone operating system, and Office Consumer. Collectively, Office Consumer
and Office 365 Consumer revenue declined 17%. D&C gross margin decreased $1.4 billion or 7%, reflecting higher
cost of revenue, offset in part by higher revenue. D&C cost of revenue increased $5.3 billion or 30%, mainly due to a
full year of Phone Hardware costs.
D&C Licensing
D&C Licensing revenue decreased $4.6 billion or 23%, mainly due to lower revenue from Windows OEM, Windows
Phone licensing, and Office Consumer. Windows OEM revenue declined $1.9 billion or 15%, primarily due to
declines of 15% in OEM Pro revenue and 16% in OEM non-Pro revenue. Windows OEM Pro revenue decreased,
primarily due to benefits realized from the expiration of support for Windows XP in the prior year, and declines in the
business PC market. Windows OEM non-Pro revenue declined, mainly due to an increased mix of opening price
point devices sold, and declines in the consumer PC market. Revenue from licensing of Windows Phone operating
system decreased $1.4 billion or 55%, primarily due to prior year revenue associated with our joint strategic initiatives
with Nokia that terminated when we acquired NDS. Office Consumer revenue declined $946 million or 29%,
reflecting the transition of customers to Office 365 Consumer, where revenue is recognized ratably, and declines in
the Japan PC market, where Office is predominantly pre-installed on new PCs.
D&C Licensing gross margin decreased $3.6 billion or 20%, primarily due to the decline in revenue, offset in part by a
$990 million or 47% decrease in cost of revenue. D&C Licensing cost of revenue decreased, mainly due to a $788
million decline in traffic acquisition costs, driven by prior year costs associated with our joint strategic initiatives with
Nokia that terminated when we acquired NDS.