Microsoft 2015 Annual Report Download - page 45
Download and view the complete annual report
Please find page 45 of the 2015 Microsoft annual report below. You can navigate through the pages in the report by either clicking on the pages listed below, or by using the keyword search tool below to find specific information within the annual report.-
 1
1 -
2
-
3
-
4
-
5
-
6
-
7
-
8
-
9
-
10
-
11
-
12
-
13
-
14
-
15
-
16
-
17
-
18
-
19
-
20
-
21
-
22
-
23
-
24
-
25
-
26
-
27
-
28
-
29
-
30
-
31
-
32
-
33
-
34
-
 35
35 -
 36
36 -
 37
37 -
 38
38 -
 39
39 -
 40
40 -
 41
41 -
 42
42 -
 43
43 -
 44
44 -
 45
45 -
 46
46 -
 47
47 -
 48
48 -
 49
49 -
 50
50 -
 51
51 -
 52
52 -
 53
53 -
 54
54 -
 55
55 -
56
-
57
-
58
-
59
-
60
-
61
-
62
-
63
-
64
-
65
-
66
-
67
-
68
-
69
-
70
-
71
-
72
-
73
-
74
-
75
-
76
-
77
-
78
-
79
-
80
-
81
-
82
-
83
-
84
-
85
-
86
-
87
-
88
-
89
 |
 |

44
CASH FLOWS STATEMENTS
(In millions)
Y
ear Ended June 30, 2015
2014 2013
Operations
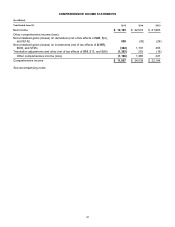
Net income $ 12,193 $ 22,074 $ 21,863
Adjustments to reconcile net income to net cash from operations:
Goodwill and asset impairments 7,498 0 0
Depreciation, amortization, and other 5,957 5,212 3,755
Stock-based compensation expense 2,574 2,446 2,406
Net recognized losses (gains) on investments and derivatives (443 ) (109) 80
Excess tax benefits from stock-based compensation (588 ) (271) (209)
Deferred income taxes 224 (331) (19)
Deferral of unearned revenue 45,072 44,325 44,253
Recognition of unearned revenue (44,920 ) (41,739) (41,921)
Changes in operating assets and liabilities:
Accounts receivable 1,456 (1,120) (1,807)
Inventories (272 ) (161) (802)
Other current assets 62 (29) (129)
Other long-term assets 346 (628) (478)
Accounts payable (1,054 ) 473 537
Other current liabilities (624 ) 1,075 146
Other long-term liabilities 1,599 1,014 1,158
Net cash from operations 29,080 32,231 28,833
Financing
Proceeds from issuance of short-term debt, maturities of 90 days or
less, net 4,481 500 0
Proceeds from issuance of debt 10,680 10,350 4,883
Repayments of debt (1,500 ) (3,888) (1,346)
Common stock issued 634 607 931
Common stock repurchased (14,443 ) (7,316) (5,360)
Common stock cash dividends paid (9,882 ) (8,879) (7,455)
Excess tax benefits from stock-based compensation 588 271 209
Other 362 (39) (10)
Net cash used in financing (9,080 ) (8,394) (8,148)
Investing
Additions to property and equipment (5,944 ) (5,485) (4,257)
Acquisition of companies, net of cash acquired, and purchases of
intangible and other assets (3,723 ) (5,937) (1,584)
Purchases of investments (98,729 ) (72,690) (75,396)
Maturities of investments 15,013 5,272 5,130
Sales of investments 70,848 60,094 52,464
Securities lending payable (466 ) (87) (168)
Net cash used in investing (23,001 ) (18,833) (23,811)
Effect of exchange rates on cash and cash equivalents (73 ) (139) (8)
Net change in cash and cash equivalents (3,074 ) 4,865 (3,134)
Cash and cash equivalents, beginning of period 8,669 3,804 6,938
Cash and cash equivalents, end of period $5,595 $ 8,669 $3,804
See accompanying notes.