Microsoft 2015 Annual Report Download - page 28
Download and view the complete annual report
Please find page 28 of the 2015 Microsoft annual report below. You can navigate through the pages in the report by either clicking on the pages listed below, or by using the keyword search tool below to find specific information within the annual report.-
 1
1 -
2
-
3
-
4
-
5
-
6
-
7
-
8
-
9
-
10
-
11
-
12
-
13
-
14
-
15
-
16
-
17
-
 18
18 -
 19
19 -
 20
20 -
 21
21 -
 22
22 -
 23
23 -
 24
24 -
 25
25 -
 26
26 -
 27
27 -
 28
28 -
 29
29 -
 30
30 -
 31
31 -
 32
32 -
 33
33 -
 34
34 -
 35
35 -
 36
36 -
 37
37 -
 38
38 -
39
-
40
-
41
-
42
-
43
-
44
-
45
-
46
-
47
-
48
-
49
-
50
-
51
-
52
-
53
-
54
-
55
-
56
-
57
-
58
-
59
-
60
-
61
-
62
-
63
-
64
-
65
-
66
-
67
-
68
-
69
-
70
-
71
-
72
-
73
-
74
-
75
-
76
-
77
-
78
-
79
-
80
-
81
-
82
-
83
-
84
-
85
-
86
-
87
-
88
-
89
 |
 |

27
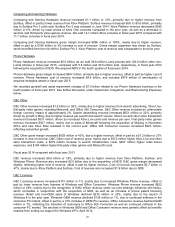
Fiscal year 2015 compared with fiscal year 2014
Commercial revenue increased $2.2 billion or 5%, mainly due to growth in revenue from our Commercial Cloud and
server products, offset in part by a decline in Office Commercial. Commercial revenue included an unfavorable
foreign currency impact of approximately 2%. Our server products and services grew 9%. Our Office Commercial
products and services declined 1%. Commercial gross margin increased $1.6 billion or 4%.
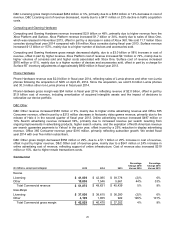
Commercial Licensing
Commercial Licensing revenue decreased $1.0 billion or 2%, primarily due to a decline in revenue from Office
Commercial, offset in part by increased revenue from our server products. Commercial Licensing revenue included
an unfavorable foreign currency impact of approximately 2%. Office Commercial revenue declined $2.5 billion or
13%, due to lower transactional license volume, reflecting a decline in the business PC market following Windows XP
end of support in the prior year, customers transitioning to Office 365 Commercial, and declines in Japan. Our server
products revenue grew $1.1 billion or 7%, primarily driven by higher premium mix of Microsoft SQL Server, Windows
Server, and System Center.
Commercial Licensing gross margin decreased $785 million or 2%, in line with revenue.
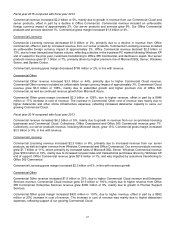
Commercial Other
Commercial Other revenue increased $3.3 billion or 44%, primarily due to higher Commercial Cloud revenue.
Commercial Other revenue included an unfavorable foreign currency impact of approximately 3%. Commercial Cloud
revenue grew $3.0 billion or 106%, mainly due to subscriber growth and higher premium mix of Office 365
Commercial, as well as continued revenue growth from Microsoft Azure.
Commercial Other gross margin increased $2.3 billion or 126%, due to higher revenue, offset in part by a $946
million or 17% increase in cost of revenue. The increase in Commercial Other cost of revenue was mainly due to
higher datacenter and other online infrastructure expenses, reflecting increased datacenter capacity to serve our
growing Commercial Cloud.
Fiscal year 2014 compared with fiscal year 2013
Commercial revenue increased $4.2 billion or 9%, mainly due to growth in revenue from our on-premises licensing
businesses and Commercial Cloud. Collectively, Office Commercial and Office 365 Commercial revenue grew 7%.
Collectively, our server products revenue, including Microsoft Azure, grew 13%. Commercial gross margin increased
$3.3 billion or 9%, in line with revenue.
Commercial Licensing
Commercial Licensing revenue increased $2.3 billion or 6%, primarily due to increased revenue from our server
products, as well as higher revenue from Windows Commercial and Office Commercial. Our server products revenue
grew $1.7 billion or 11%, driven primarily by increased sales of Microsoft SQL Server. Windows Commercial revenue
grew $334 million or 10%, mainly due to increased renewal rates and transactional purchases driven by Windows XP
end of support. Office Commercial revenue grew $219 million or 1%, and was impacted by customers transitioning to
Office 365 Commercial.
Commercial Licensing gross margin increased $2.3 billion or 6%, in line with revenue growth.
Commercial Other
Commercial Other revenue increased $1.9 billion or 33%, due to higher Commercial Cloud revenue and Enterprise
Services revenue. Commercial Cloud revenue grew $1.5 billion or 116%, mainly due to higher revenue from Office
365 Commercial. Enterprise Services revenue grew $380 million or 9%, mainly due to growth in Premier Support
Services.
Commercial Other gross margin increased $933 million or 101%, due to higher revenue, offset in part by a $952
million or 20% increase in cost of revenue. The increase in cost of revenue was mainly due to higher datacenter
expenses, reflecting support of our growing Commercial Cloud.