Microsoft 2015 Annual Report Download - page 33
Download and view the complete annual report
Please find page 33 of the 2015 Microsoft annual report below. You can navigate through the pages in the report by either clicking on the pages listed below, or by using the keyword search tool below to find specific information within the annual report.-
 1
1 -
2
-
3
-
4
-
5
-
6
-
7
-
8
-
9
-
10
-
11
-
12
-
13
-
14
-
15
-
16
-
17
-
18
-
19
-
20
-
21
-
22
-
 23
23 -
 24
24 -
 25
25 -
 26
26 -
 27
27 -
 28
28 -
 29
29 -
 30
30 -
 31
31 -
 32
32 -
 33
33 -
 34
34 -
 35
35 -
 36
36 -
 37
37 -
 38
38 -
 39
39 -
 40
40 -
 41
41 -
 42
42 -
 43
43 -
44
-
45
-
46
-
47
-
48
-
49
-
50
-
51
-
52
-
53
-
54
-
55
-
56
-
57
-
58
-
59
-
60
-
61
-
62
-
63
-
64
-
65
-
66
-
67
-
68
-
69
-
70
-
71
-
72
-
73
-
74
-
75
-
76
-
77
-
78
-
79
-
80
-
81
-
82
-
83
-
84
-
85
-
86
-
87
-
88
-
89
 |
 |

32
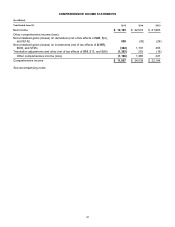
FINANCIAL CONDITION
Cash, Cash Equivalents, and Investments
Cash, cash equivalents, and short-term investments totaled $96.5 billion as of June 30, 2015, compared with $85.7
billion as of June 30, 2014. Equity and other investments were $12.1 billion as of June 30, 2015, compared with
$14.6 billion as of June 30, 2014. Our short-term investments are primarily to facilitate liquidity and for capital
preservation. They consist predominantly of highly liquid investment-grade fixed-income securities, diversified among
industries and individual issuers. The investments are predominantly U.S. dollar-denominated securities, but also
include foreign currency-denominated securities in order to diversify risk. Our fixed-income investments are exposed
to interest rate risk and credit risk. The credit risk and average maturity of our fixed-income portfolio are managed to
achieve economic returns that correlate to certain fixed-income indices. The settlement risk related to these
investments is insignificant given that the short-term investments held are primarily highly liquid investment-grade
fixed-income securities.
Of the cash, cash equivalents, and short-term investments at June 30, 2015, $94.4 billion was held by our foreign
subsidiaries and would be subject to material repatriation tax effects. The amount of cash, cash equivalents, and
short-term investments held by foreign subsidiaries subject to other restrictions on the free flow of funds (primarily
currency and other local regulatory) was $2.1 billion. As of June 30, 2015, approximately 79% of the cash
equivalents and short-term investments held by our foreign subsidiaries were invested in U.S. government and
agency securities, approximately 5% were invested in corporate notes and bonds of U.S. companies, and
approximately 5% were invested in U.S. mortgage- and asset-backed securities, all of which are denominated in U.S.
dollars.
Securities lending
We lend certain fixed-income and equity securities to increase investment returns. The loaned securities continue to
be carried as investments on our balance sheet. Cash and/or security interests are received as collateral for the
loaned securities with the amount determined based upon the underlying security lent and the creditworthiness of the
borrower. Cash received is recorded as an asset with a corresponding liability. Our securities lending payable
balance was $92 million as of June 30, 2015. Our average and maximum securities lending payable balances for the
fiscal year were $287 million and $750 million, respectively. Intra-year variances in the amount of securities loaned
are mainly due to fluctuations in the demand for the securities.
Valuation
In general, and where applicable, we use quoted prices in active markets for identical assets or liabilities to
determine the fair value of our financial instruments. This pricing methodology applies to our Level 1 investments,
such as exchange-traded mutual funds, domestic and international equities, and U.S. government securities. If
quoted prices in active markets for identical assets or liabilities are not available to determine fair value, then we use
quoted prices for similar assets and liabilities or inputs other than the quoted prices that are observable either directly
or indirectly. This pricing methodology applies to our Level 2 investments such as corporate notes and bonds,
common and preferred stock, foreign government bonds, mortgage- and asset-backed securities, U.S. government
and agency securities, and certificates of deposit. Level 3 investments are valued using internally developed models
with unobservable inputs. Assets and liabilities measured at fair value on a recurring basis using unobservable inputs
are an immaterial portion of our portfolio.
A majority of our investments are priced by pricing vendors and are generally Level 1 or Level 2 investments as
these vendors either provide a quoted market price in an active market or use observable inputs for their pricing
without applying significant adjustments. Broker pricing is used mainly when a quoted price is not available, the
investment is not priced by our pricing vendors, or when a broker price is more reflective of fair values in the market
in which the investment trades. Our broker-priced investments are generally classified as Level 2 investments
because the broker prices these investments based on similar assets without applying significant adjustments. In
addition, all of our broker-priced investments have a sufficient level of trading volume to demonstrate that the fair
values used are appropriate for these investments. Our fair value processes include controls that are designed to
ensure appropriate fair values are recorded. These controls include model validation, review of key model inputs,
analysis of period-over-period fluctuations, and independent recalculation of prices where appropriate.