Microsoft 2015 Annual Report Download - page 26
Download and view the complete annual report
Please find page 26 of the 2015 Microsoft annual report below. You can navigate through the pages in the report by either clicking on the pages listed below, or by using the keyword search tool below to find specific information within the annual report.-
 1
1 -
2
-
3
-
4
-
5
-
6
-
7
-
8
-
9
-
10
-
11
-
12
-
13
-
14
-
15
-
 16
16 -
 17
17 -
 18
18 -
 19
19 -
 20
20 -
 21
21 -
 22
22 -
 23
23 -
 24
24 -
 25
25 -
 26
26 -
 27
27 -
 28
28 -
 29
29 -
 30
30 -
 31
31 -
 32
32 -
 33
33 -
 34
34 -
 35
35 -
 36
36 -
37
-
38
-
39
-
40
-
41
-
42
-
43
-
44
-
45
-
46
-
47
-
48
-
49
-
50
-
51
-
52
-
53
-
54
-
55
-
56
-
57
-
58
-
59
-
60
-
61
-
62
-
63
-
64
-
65
-
66
-
67
-
68
-
69
-
70
-
71
-
72
-
73
-
74
-
75
-
76
-
77
-
78
-
79
-
80
-
81
-
82
-
83
-
84
-
85
-
86
-
87
-
88
-
89
 |
 |

25
Computing and Gaming Hardware
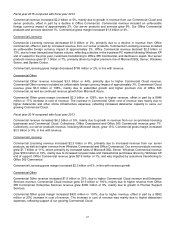
Computing and Gaming Hardware revenue increased $1.1 billion or 12%, primarily due to higher revenue from
Surface, offset in part by lower revenue from Xbox Platform. Surface revenue increased 65% to $3.6 billion, primarily
due to Surface Pro 3 units sold. Surface Pro 3 was released in June 2014. Xbox Platform revenue decreased $385
million or 6%, driven by lower prices of Xbox One consoles compared to the prior year, as well as a decrease in
second- and third-party video games revenue. We sold 12.1 million Xbox consoles in fiscal year 2015 compared with
11.7 million consoles in fiscal year 2014.
Computing and Gaming Hardware gross margin increased $896 million or 100%, mainly due to higher revenue,
offset in part by a $194 million or 2% increase in cost of revenue. Gross margin expansion was driven by Surface,
which benefited from the mix shift to Surface Pro 3. Xbox Platform cost of revenue was comparable to the prior year.
Phone Hardware
Phone Hardware revenue increased $5.5 billion, as we sold 36.8 million Lumia phones and 126.8 million other non-
Lumia phones in fiscal year 2015, compared with 5.8 million and 30.3 million sold, respectively, in fiscal year 2014
following the acquisition of NDS. We acquired NDS in the fourth quarter of fiscal year 2014.
Phone Hardware gross margin increased $647 million, primarily due to higher revenue, offset in part by higher cost of
revenue. Phone Hardware cost of revenue increased $4.9 billion, and included $476 million of amortization of
acquired intangible assets in fiscal year 2015.
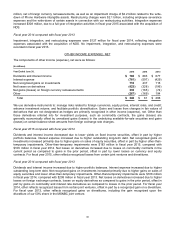
We recorded goodwill and asset impairment charges of $7.5 billion related to our Phone Hardware business in the
fourth quarter of fiscal year 2015. See further discussion under Impairment, Integration, and Restructuring Expenses
below.
D&C Other
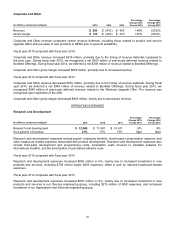
D&C Other revenue increased $1.8 billion or 26%, mainly due to higher revenue from search advertising, Xbox Live,
first-party video games, including Minecraft, and Office 365 Consumer. D&C Other revenue included an unfavorable
foreign currency impact of approximately 2%. Search advertising revenue increased $651 million or 22%, primarily
driven by growth in Bing, due to higher revenue per search and search volume. Xbox Live and other store transaction
revenue increased $531 million, driven by increased Xbox Live users and revenue per user. First-party video games
revenue increased $367 million, mainly due to sales of Minecraft following the acquisition of Mojang in November
2014, and new Xbox titles released in the current year. Office 365 Consumer revenue increased $323 million,
reflecting subscriber growth.
D&C Other gross margin increased $629 million or 45%, due to higher revenue, offset in part by a $1.2 billion or 21%
increase in cost of revenue. D&C Other cost of revenue grew, mainly due to $372 million higher Xbox Live and other
store transaction costs, a $279 million increase in search infrastructure costs, $267 million higher retail stores
expenses, and $194 million higher first-party video games and Minecraft costs.
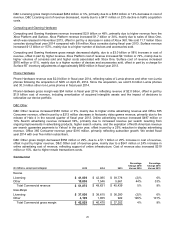
Fiscal year 2014 compared with fiscal year 2013
D&C revenue increased $5.6 billion or 18%, primarily due to higher revenue from Xbox Platform, Surface, and
Windows Phone. Revenue also increased $2.0 billion due to the acquisition of NDS. D&C gross margin decreased
slightly, reflecting higher cost of revenue, offset in part by higher revenue. Cost of revenue increased $5.7 billion or
47%, mainly due to Xbox Platform and Surface. Cost of revenue also increased $1.9 billion due to NDS.
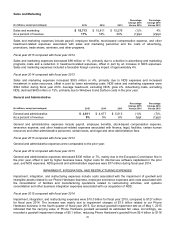
D&C Licensing
D&C Licensing revenue increased $101 million or 1%, mainly due to increased Windows Phone revenue, offset in
part by lower revenue from licenses of Windows and Office Consumer. Windows Phone revenue increased $822
million or 48%, mainly due to the recognition of $382 million revenue under our joint strategic initiatives with Nokia,
which concluded in conjunction with the acquisition of NDS, as well as an increase in phone patent licensing
revenue. Retail and non-OEM sales of Windows declined $274 million or 35%, mainly due to the launch of
Windows 8 in the prior year. Windows OEM revenue declined $136 million or 1%, due to continued softness in the
consumer PC market, offset in part by a 12% increase in OEM Pro revenue. Office Consumer revenue declined $249
million or 7%, reflecting the transition of customers to Office 365 Consumer as well as continued softness in the
consumer PC market. The declines in Windows OEM and Office Consumer revenue were partially offset by benefits
realized from ending our support for Windows XP in April 2014.