Microsoft 2015 Annual Report Download - page 61
Download and view the complete annual report
Please find page 61 of the 2015 Microsoft annual report below. You can navigate through the pages in the report by either clicking on the pages listed below, or by using the keyword search tool below to find specific information within the annual report.-
 1
1 -
2
-
3
-
4
-
5
-
6
-
7
-
8
-
9
-
10
-
11
-
12
-
13
-
14
-
15
-
16
-
17
-
18
-
19
-
20
-
21
-
22
-
23
-
24
-
25
-
26
-
27
-
28
-
29
-
30
-
31
-
32
-
33
-
34
-
35
-
36
-
37
-
38
-
39
-
40
-
41
-
42
-
43
-
44
-
45
-
46
-
47
-
48
-
49
-
50
-
 51
51 -
 52
52 -
 53
53 -
 54
54 -
 55
55 -
 56
56 -
 57
57 -
 58
58 -
 59
59 -
 60
60 -
 61
61 -
 62
62 -
 63
63 -
 64
64 -
 65
65 -
 66
66 -
 67
67 -
 68
68 -
 69
69 -
 70
70 -
 71
71 -
72
-
73
-
74
-
75
-
76
-
77
-
78
-
79
-
80
-
81
-
82
-
83
-
84
-
85
-
86
-
87
-
88
-
89
 |
 |

60
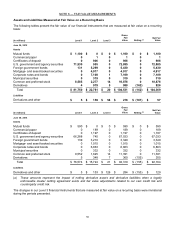
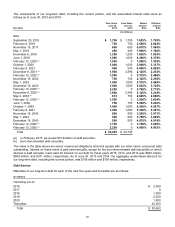
The following table reconciles the total “Net Fair Value” of assets above to the balance sheet presentation of these
same assets in Note 4 – Investments.
(In millions)
June 30, 2015 2014
Net fair value of assets measured at fair value on a recurring basis $ 104,369 $92,164
Cash 3,679 4,980
Common and preferred stock measured at fair value on a nonrecurring basis 561 520
Other investments measured at fair value on a nonrecurring basis 589 1,150
Less derivative net assets classified as other current assets (648) (38)
Other 4 (6)
Recorded basis of investment components $ 108,554 $ 98,770
Financial Assets and Liabilities Measured at Fair Value on a Nonrecurring Basis
During fiscal year 2015 and 2014, we did not record any material other-than-temporary impairments on financial
assets required to be measured at fair value on a nonrecurring basis.
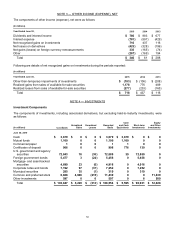
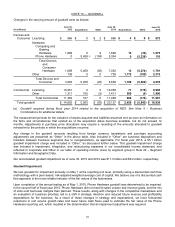
NOTE 7 — INVENTORIES
The components of inventories were as follows:
(In millions)
June 30, 2015 2014
Raw materials $ 1,100 $944
Work in process 202 266
Finished goods 1,600 1,450
Total $ 2,902 $ 2,660
NOTE 8 — PROPERTY AND EQUIPMENT
The components of property and equipment were as follows:
(In millions)
June 30, 2015 2014
Land $ 769 $541
Buildings and improvements 10,800 8,867
Leasehold improvements 3,577 3,560
Computer equipment and software 13,612 11,430
Furniture and equipment 3,579 3,406
Total, at cost 32,337 27,804
Accumulated depreciation (17,606) (14,793)
Total, net $ 14,731 $13,011
During fiscal years 2015, 2014, and 2013, depreciation expense was $4.1 billion, $3.4 billion, and $2.6 billion,
respectively.
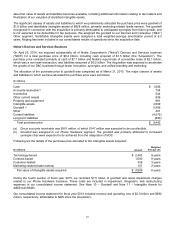
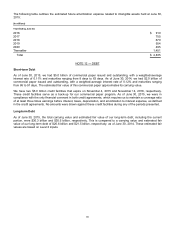
NOTE 9 — BUSINESS COMBINATIONS
Mojang Synergies AB
On November 6, 2014, we acquired Mojang Synergies AB (“Mojang”), the Swedish video game developer of the
Minecraft gaming franchise, for $2.5 billion in cash, net of cash acquired. The addition of Minecraft and its community
enhances our gaming portfolio across Windows, Xbox, and other ecosystems besides our own. Our purchase price
allocation is preliminary and subject to revision as more detailed analyses are completed and additional information