Microsoft 2015 Annual Report Download - page 34
Download and view the complete annual report
Please find page 34 of the 2015 Microsoft annual report below. You can navigate through the pages in the report by either clicking on the pages listed below, or by using the keyword search tool below to find specific information within the annual report.-
 1
1 -
2
-
3
-
4
-
5
-
6
-
7
-
8
-
9
-
10
-
11
-
12
-
13
-
14
-
15
-
16
-
17
-
18
-
19
-
20
-
21
-
22
-
23
-
 24
24 -
 25
25 -
 26
26 -
 27
27 -
 28
28 -
 29
29 -
 30
30 -
 31
31 -
 32
32 -
 33
33 -
 34
34 -
 35
35 -
 36
36 -
 37
37 -
 38
38 -
 39
39 -
 40
40 -
 41
41 -
 42
42 -
 43
43 -
 44
44 -
45
-
46
-
47
-
48
-
49
-
50
-
51
-
52
-
53
-
54
-
55
-
56
-
57
-
58
-
59
-
60
-
61
-
62
-
63
-
64
-
65
-
66
-
67
-
68
-
69
-
70
-
71
-
72
-
73
-
74
-
75
-
76
-
77
-
78
-
79
-
80
-
81
-
82
-
83
-
84
-
85
-
86
-
87
-
88
-
89
 |
 |

33
Cash Flows
Fiscal year 2015 compared with fiscal year 2014
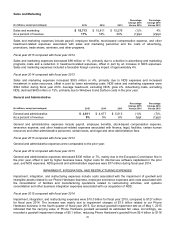
Cash flows from operations decreased $3.2 billion during the fiscal year to $29.1 billion, mainly due to an increase in
materials and production costs in support of sales growth as well as payments related to restructuring charges and
other changes in working capital, offset in part by increases in cash received from customers. Cash used in financing
increased $686 million to $9.1 billion, mainly due to a $7.1 billion increase in cash used for common stock
repurchases, offset in part by a $6.7 billion increase in proceeds from issuances of debt, net of repayments. Cash
used in investing increased $4.2 billion to $23.0 billion, mainly due to a $5.5 billion increase in cash used for net
investment purchases, sales, and maturities, partially offset by a $2.2 billion decrease in cash used for acquisitions of
companies and purchases of intangible and other assets.
Fiscal year 2014 compared with fiscal year 2013
Cash flows from operations increased $3.4 billion during fiscal year 2014 to $32.2 billion, mainly due to increases in
cash received from customers. Cash used in financing increased $246 million to $8.4 billion, mainly due to a $2.0
billion increase in cash used for common stock repurchases, a $1.4 billion increase in dividends paid, and a $324
million decrease in proceeds from the issuance of common stock, offset in part by a $3.4 billion increase in proceeds
from issuances of debt, net of repayments. Cash used in investing decreased $5.0 billion to $18.8 billion, mainly due
to a $10.5 billion decrease in cash used for net investment purchases, sales, and maturities, offset in part by a $4.4
billion increase in cash used for acquisition of companies and purchases of intangible and other assets, and a $1.2
billion increase in capital expenditures for property and equipment.
Debt
We issued debt to take advantage of favorable pricing and liquidity in the debt markets, reflecting our credit rating
and the low interest rate environment. The proceeds of these issuances were or will be used for general corporate
purposes, which may include, among other things, funding for working capital, capital expenditures, repurchases of
capital stock, acquisitions, and repayment of existing debt. See Note 12 – Debt of the Notes to Financial Statements
for further discussion.
Unearned Revenue
Unearned revenue at June 30, 2015 was comprised mainly of unearned revenue from volume licensing programs.
Unearned revenue from volume licensing programs represents customer billings for multi-year licensing
arrangements paid for either at inception of the agreement or annually at the beginning of each coverage period and
accounted for as subscriptions with revenue recognized ratably over the coverage period. Unearned revenue at
June 30, 2015 also included payments for: post-delivery support and consulting services to be performed in the
future; Xbox Live subscriptions and prepaid points; Microsoft Dynamics business solutions products; Office 365
subscriptions; Skype prepaid credits and subscriptions; Bundled Offerings; and other offerings for which we have
been paid in advance and earn the revenue when we provide the service or software, or otherwise meet the revenue
recognition criteria.
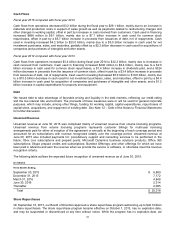
The following table outlines the expected future recognition of unearned revenue as of June 30, 2015:
(In millions)
Three Months Ending,
September 30, 2015 $8,889
December 31, 2015 7,172
March 31, 2016 4,848
June 30, 2016 2,314
Thereafter 2,095
Total $ 25,318
Share Repurchases
On September 16, 2013, our Board of Directors approved a share repurchase program authorizing up to $40.0 billion
in share repurchases. The share repurchase program became effective on October 1, 2013, has no expiration date,
and may be suspended or discontinued at any time without notice. While the program has no expiration date, we