MasterCard 2013 Annual Report Download - page 91
Download and view the complete annual report
Please find page 91 of the 2013 MasterCard annual report below. You can navigate through the pages in the report by either clicking on the pages listed below, or by using the keyword search tool below to find specific information within the annual report.-
 1
1 -
2
-
3
-
4
-
5
-
6
-
7
-
8
-
9
-
10
-
11
-
12
-
13
-
14
-
15
-
16
-
17
-
18
-
19
-
20
-
21
-
22
-
23
-
24
-
25
-
26
-
27
-
28
-
29
-
30
-
31
-
32
-
33
-
34
-
35
-
36
-
37
-
38
-
39
-
40
-
41
-
42
-
43
-
44
-
45
-
46
-
47
-
48
-
49
-
50
-
51
-
52
-
53
-
54
-
55
-
56
-
57
-
58
-
59
-
60
-
61
-
62
-
63
-
64
-
65
-
66
-
67
-
68
-
69
-
70
-
71
-
72
-
73
-
74
-
75
-
76
-
77
-
78
-
79
-
80
-
 81
81 -
 82
82 -
 83
83 -
 84
84 -
 85
85 -
 86
86 -
 87
87 -
 88
88 -
 89
89 -
 90
90 -
 91
91 -
 92
92 -
 93
93 -
 94
94 -
 95
95 -
 96
96 -
 97
97 -
 98
98 -
 99
99 -
 100
100 -
 101
101 -
102
-
103
-
104
-
105
-
106
-
107
-
108
-
109
-
110
-
111
-
112
-
113
-
114
-
115
-
116
-
117
-
118
-
119
-
120
 |
 |

MASTERCARD INCORPORATED
NOTES TO CONSOLIDATED FINANCIAL STATEMENTS – (Continued)
87
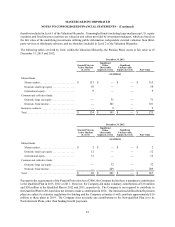
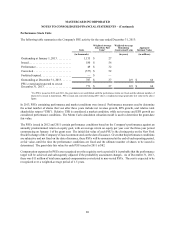
The following table summarizes the Company's option activity for the year ended December 31, 2013:
Options Weighted-Average
Exercise Price
Weighted-Average
Remaining
Contractual Term Aggregate
Intrinsic Value
(in thousands) (in years) (in millions)
Outstanding at January 1, 2013 . . . . . . . . . . 6,415 $ 25
Granted . . . . . . . . . . . . . . . . . . . . . . . . . . . . 1,832 $ 52
Exercised . . . . . . . . . . . . . . . . . . . . . . . . . . . (1,242) $ 21
Forfeited/expired . . . . . . . . . . . . . . . . . . . . . (45) $ 46
Outstanding at December 31, 2013 . . . . . . . 6,960 $ 33 7.1 $ 355
Exercisable at December 31, 2013 . . . . . . . 2,965 $ 21 5.7 $ 185
Options vested and expected to vest at
December 31, 2013 . . . . . . . . . . . . . . . . . . . 6,862 $ 32 7.1 $ 351
As of December 31, 2013, there was $24 million of total unrecognized compensation cost related to non-vested options.
The cost is expected to be recognized over a weighted-average period of 2.6 years.
Restricted Stock Units
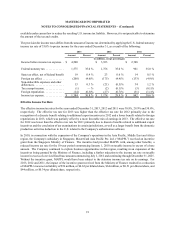
The following table summarizes the Company's RSU activity for the year ended December 31, 2013:
Units
Weighted-Average
Grant-Date Fair
Value
Weighted-Average
Remaining
Contractual Term Aggregate
Intrinsic Value
(in thousands) (in years) (in millions)
Outstanding at January 1, 2013 . . . . . . . . . . 5,456 $ 30
Granted . . . . . . . . . . . . . . . . . . . . . . . . . . . . 1,530 $ 52
Converted . . . . . . . . . . . . . . . . . . . . . . . . . . (1,496) $ 23
Forfeited/expired . . . . . . . . . . . . . . . . . . . . . (160) $ 36
Outstanding at December 31, 2013 . . . . . . . 5,330 $ 38 1.1 $ 445
RSUs vested and expected to vest at
December 31, 2013 . . . . . . . . . . . . . . . . . . . 5,165 $ 38 1.1 $ 432
The fair value of each RSU is the closing stock price on the New York Stock Exchange of the Company's Class A
common stock on the date of grant, adjusted for the exclusion of dividend equivalents. Upon vesting, a portion of the
RSU award may be withheld to satisfy the minimum statutory withholding taxes. The remaining RSUs will be settled
in shares of the Company's Class A common stock after the vesting period. As of December 31, 2013, there was $83
million of total unrecognized compensation cost related to non-vested RSUs. The cost is expected to be recognized
over a weighted-average period of 1.8 years.