MasterCard 2013 Annual Report Download - page 46
Download and view the complete annual report
Please find page 46 of the 2013 MasterCard annual report below. You can navigate through the pages in the report by either clicking on the pages listed below, or by using the keyword search tool below to find specific information within the annual report.-
 1
1 -
2
-
3
-
4
-
5
-
6
-
7
-
8
-
9
-
10
-
11
-
12
-
13
-
14
-
15
-
16
-
17
-
18
-
19
-
20
-
21
-
22
-
23
-
24
-
25
-
26
-
27
-
28
-
29
-
30
-
31
-
32
-
33
-
34
-
35
-
 36
36 -
 37
37 -
 38
38 -
 39
39 -
 40
40 -
 41
41 -
 42
42 -
 43
43 -
 44
44 -
 45
45 -
 46
46 -
 47
47 -
 48
48 -
 49
49 -
 50
50 -
 51
51 -
 52
52 -
 53
53 -
 54
54 -
 55
55 -
 56
56 -
57
-
58
-
59
-
60
-
61
-
62
-
63
-
64
-
65
-
66
-
67
-
68
-
69
-
70
-
71
-
72
-
73
-
74
-
75
-
76
-
77
-
78
-
79
-
80
-
81
-
82
-
83
-
84
-
85
-
86
-
87
-
88
-
89
-
90
-
91
-
92
-
93
-
94
-
95
-
96
-
97
-
98
-
99
-
100
-
101
-
102
-
103
-
104
-
105
-
106
-
107
-
108
-
109
-
110
-
111
-
112
-
113
-
114
-
115
-
116
-
117
-
118
-
119
-
120
 |
 |

42
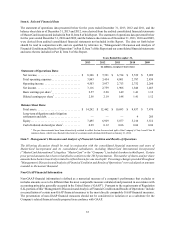
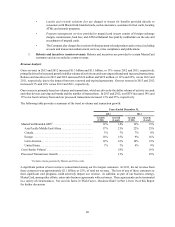
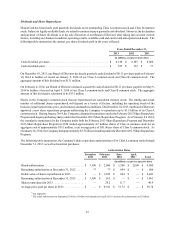
The following table compares and reconciles operating expenses, excluding the MDL Provision, which is a non-GAAP
financial measure, to the operating expenses including the MDL Provision, which is the most directly comparable
GAAP measurement. Management believes this analysis facilitates understanding of our ongoing operating expenses
and allows for a more meaningful comparison between periods.
For the Years Ended December 31,
2013 2012 2011
Actual MDL
Provision Non-
GAAP Actual MDL
Provision Non-
GAAP Actual MDL
Provision Non-
GAAP
(in millions, except percentages)
General and
administrative . . . . . . . . . . $2,649 $ — $2,649 $2,429 $ — $2,429 $2,196 $ — $2,196
Advertising and
marketing . . . . . . . . . . . . . 841 — 841 775 — 775 841 — 841
Depreciation and
amortization . . . . . . . . . . . 258 — 258 230 — 230 194 — 194
Provision for litigation
settlement . . . . . . . . . . . . . 95 (95) — 20 (20) — 770 (770) —
Total operating expenses. . $3,843 $ (95) $3,748 $3,454 $ (20) $3,434 $4,001 $ (770) $3,231
Total operating expenses
as a percentage of net
revenue . . . . . . . . . . . . . . . 46.0% 44.9% 46.7% 46.5% 59.6% 48.1%
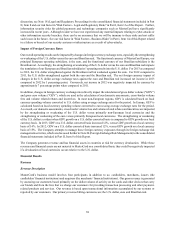
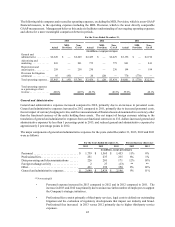
General and Administrative
General and administrative expenses increased compared to 2012, primarily due to an increase in personnel costs.
General and administrative expenses increased in 2012 compared to 2011, primarily due to increased personnel costs,
the net impact of currency hedging activities and the remeasurement of financial assets denominated in a currency other
than the functional currency of the entity holding those assets. The net impact of foreign currency relating to the
translation of general and administrative expenses from our functional currencies to U.S. dollars increased general and
administrative expenses by less than 1 percentage point in 2013, and reduced general and administrative expenses by
approximately 2 percentage points in 2012.
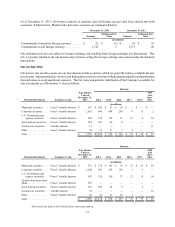
The major components of general and administrative expenses for the years ended December 31, 2013, 2012 and 2011
were as follows:
For the Years Ended December 31, Percent Increase (Decrease)
2013 2012 2011 2013 2012
(in millions, except percentages)
Personnel . . . . . . . . . . . . . . . . . . . . . . . . . . . . . . . $ 1,739 $ 1,565 $ 1,453 11% 8%
Professional fees. . . . . . . . . . . . . . . . . . . . . . . . . . 251 237 235 6% 1%
Data processing and telecommunications . . . . . . 226 201 171 12% 18%
Foreign exchange activity . . . . . . . . . . . . . . . . . . 2 27 (13) ** **
Other. . . . . . . . . . . . . . . . . . . . . . . . . . . . . . . . . . . 431 399 350 8% 14%
General and administrative expenses. . . . . . . . . . $ 2,649 $ 2,429 $ 2,196 9% 11%
** Not meaningful
• Personnel expense increased in 2013 compared to 2012 and in 2012 compared to 2011. The
increase in 2013 and 2012 was primarily due to an increase in the number of employees to support
the Company's strategic initiatives.
• Professional fees consist primarily of third-party services, legal costs to defend our outstanding
litigation and the evaluation of regulatory developments that impact our industry and brand.
Professional fees increased in 2013 versus 2012 primarily due to higher third-party service
expenses.