MasterCard 2013 Annual Report Download - page 39
Download and view the complete annual report
Please find page 39 of the 2013 MasterCard annual report below. You can navigate through the pages in the report by either clicking on the pages listed below, or by using the keyword search tool below to find specific information within the annual report.-
 1
1 -
2
-
3
-
4
-
5
-
6
-
7
-
8
-
9
-
10
-
11
-
12
-
13
-
14
-
15
-
16
-
17
-
18
-
19
-
20
-
21
-
22
-
23
-
24
-
25
-
26
-
27
-
28
-
 29
29 -
 30
30 -
 31
31 -
 32
32 -
 33
33 -
 34
34 -
 35
35 -
 36
36 -
 37
37 -
 38
38 -
 39
39 -
 40
40 -
 41
41 -
 42
42 -
 43
43 -
 44
44 -
 45
45 -
 46
46 -
 47
47 -
 48
48 -
 49
49 -
50
-
51
-
52
-
53
-
54
-
55
-
56
-
57
-
58
-
59
-
60
-
61
-
62
-
63
-
64
-
65
-
66
-
67
-
68
-
69
-
70
-
71
-
72
-
73
-
74
-
75
-
76
-
77
-
78
-
79
-
80
-
81
-
82
-
83
-
84
-
85
-
86
-
87
-
88
-
89
-
90
-
91
-
92
-
93
-
94
-
95
-
96
-
97
-
98
-
99
-
100
-
101
-
102
-
103
-
104
-
105
-
106
-
107
-
108
-
109
-
110
-
111
-
112
-
113
-
114
-
115
-
116
-
117
-
118
-
119
-
120
 |
 |

35
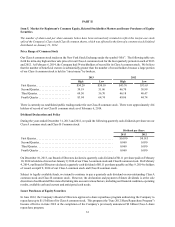
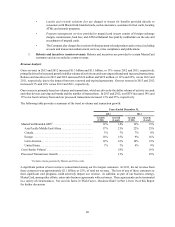
Item 6. Selected Financial Data
The statement of operations data presented below for the years ended December 31, 2013, 2012 and 2011, and the
balance sheet data as of December 31, 2013 and 2012, were derived from the audited consolidated financial statements
of MasterCard Incorporated included in Part II, Item 8 of this Report. The statement of operations data presented below
for the years ended December 31, 2010 and 2009, and the balance sheet data as of December 31, 2011, 2010 and 2009,
were derived from audited consolidated financial statements not included in this Report. The data set forth below
should be read in conjunction with, and are qualified by reference to, “Management's Discussion and Analysis of
Financial Condition and Results of Operations” in Part II, Item 7 of this Report and our consolidated financial statements
and notes thereto included in Part II, Item 8 of this Report.
Years Ended December 31,
2013 2012 2011 2010 2009
(in millions, except per share data)
Statement of Operations Data:
Net revenue . . . . . . . . . . . . . . . . . . . . . . . . . . . . . . $ 8,346 $ 7,391 $ 6,714 $ 5,539 $ 5,099
Total operating expenses . . . . . . . . . . . . . . . . . . . . 3,843 3,454 4,001 2,787 2,839
Operating income. . . . . . . . . . . . . . . . . . . . . . . . . . 4,503 3,937 2,713 2,752 2,260
Net income. . . . . . . . . . . . . . . . . . . . . . . . . . . . . . . 3,116 2,759 1,906 1,846 1,463
Basic earnings per share1. . . . . . . . . . . . . . . . . . . . 2.57 2.20 1.49 1.41 1.12
Diluted earnings per share1. . . . . . . . . . . . . . . . . . 2.56 2.19 1.48 1.41 1.12
Balance Sheet Data:
Total assets. . . . . . . . . . . . . . . . . . . . . . . . . . . . . . . $ 14,242 $ 12,462 $ 10,693 $ 8,837 $ 7,470
Long-term obligations under litigation
settlements and debt. . . . . . . . . . . . . . . . . . . . . . . . — — — 4 285
Equity. . . . . . . . . . . . . . . . . . . . . . . . . . . . . . . . . . . 7,495 6,929 5,877 5,216 3,512
Cash dividends declared per share1. . . . . . . . . . . . 0.29 0.12 0.06 0.06 0.06
1 The per share amounts have been retroactively restated to reflect the ten-for-one stock split of the Company's Class A and Class B
common shares, which was effected in the form of a common stock dividend distributed on January 21, 2014.
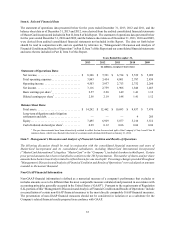
Item 7. Management’s Discussion and Analysis of Financial Condition and Results of Operations
The following discussion should be read in conjunction with the consolidated financial statements and notes of
MasterCard Incorporated and its consolidated subsidiaries, including MasterCard International Incorporated
(“MasterCard International”) (together, “MasterCard” or the “Company”), included elsewhere in this Report. Certain
prior period amounts have been reclassified to conform to the 2013 presentation. The number of shares and per share
amounts have been retroactively restated to reflect the ten-for-one stock split. Percentage changes provided throughout
"Management’s Discussion and Analysis of Financial Condition and Results of Operations" were calculated on amounts
rounded to the nearest thousand.
Non-GAAP Financial Information
Non-GAAP financial information is defined as a numerical measure of a company's performance that excludes or
includes amounts so as to be different than the most comparable measure calculated and presented in accordance with
accounting principles generally accepted in the United States (“GAAP”). Pursuant to the requirements of Regulation
S-K, portions of this “Management's Discussion and Analysis of Financial Condition and Results of Operations” include
a reconciliation of certain non-GAAP financial measures to the most directly comparable GAAP financial measures.
The presentation of non-GAAP financial measures should not be considered in isolation or as a substitute for the
Company's related financial results prepared in accordance with GAAP.