MasterCard 2013 Annual Report Download - page 77
Download and view the complete annual report
Please find page 77 of the 2013 MasterCard annual report below. You can navigate through the pages in the report by either clicking on the pages listed below, or by using the keyword search tool below to find specific information within the annual report.-
 1
1 -
2
-
3
-
4
-
5
-
6
-
7
-
8
-
9
-
10
-
11
-
12
-
13
-
14
-
15
-
16
-
17
-
18
-
19
-
20
-
21
-
22
-
23
-
24
-
25
-
26
-
27
-
28
-
29
-
30
-
31
-
32
-
33
-
34
-
35
-
36
-
37
-
38
-
39
-
40
-
41
-
42
-
43
-
44
-
45
-
46
-
47
-
48
-
49
-
50
-
51
-
52
-
53
-
54
-
55
-
56
-
57
-
58
-
59
-
60
-
61
-
62
-
63
-
64
-
65
-
66
-
 67
67 -
 68
68 -
 69
69 -
 70
70 -
 71
71 -
 72
72 -
 73
73 -
 74
74 -
 75
75 -
 76
76 -
 77
77 -
 78
78 -
 79
79 -
 80
80 -
 81
81 -
 82
82 -
 83
83 -
 84
84 -
 85
85 -
 86
86 -
 87
87 -
88
-
89
-
90
-
91
-
92
-
93
-
94
-
95
-
96
-
97
-
98
-
99
-
100
-
101
-
102
-
103
-
104
-
105
-
106
-
107
-
108
-
109
-
110
-
111
-
112
-
113
-
114
-
115
-
116
-
117
-
118
-
119
-
120
 |
 |

MASTERCARD INCORPORATED
NOTES TO CONSOLIDATED FINANCIAL STATEMENTS – (Continued)
73
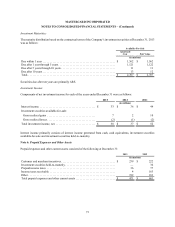
Investment Maturities:
The maturity distribution based on the contractual terms of the Company’s investment securities at December 31, 2013
was as follows:
Available-For-Sale
Amortized
Cost Fair Value
(in millions)
Due within 1 year . . . . . . . . . . . . . . . . . . . . . . . . . . . . . . . . . . . . . . . . . . . . . . . . . . . $ 1,562 $ 1,562
Due after 1 year through 5 years. . . . . . . . . . . . . . . . . . . . . . . . . . . . . . . . . . . . . . . . 1,121 1,122
Due after 5 years through 10 years . . . . . . . . . . . . . . . . . . . . . . . . . . . . . . . . . . . . . . 11 11
Due after 10 years . . . . . . . . . . . . . . . . . . . . . . . . . . . . . . . . . . . . . . . . . . . . . . . . . . . 13 12
Total. . . . . . . . . . . . . . . . . . . . . . . . . . . . . . . . . . . . . . . . . . . . . . . . . . . . . . . . . . . . . . $ 2,707 $ 2,707
Securities due after ten years are primarily ARS.
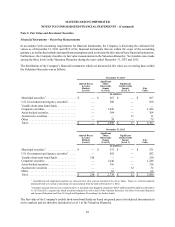
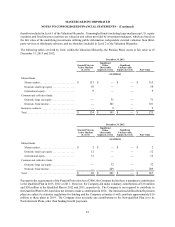
Investment Income:
Components of net investment income for each of the years ended December 31 were as follows:
2013 2012 2011
(in millions)
Interest income . . . . . . . . . . . . . . . . . . . . . . . . . . . . . . . . . . . . . . . $ 33 $ 36 $ 44
Investment securities available-for-sale:
Gross realized gains . . . . . . . . . . . . . . . . . . . . . . . . . . . . . . . . . . 7 2 10
Gross realized losses. . . . . . . . . . . . . . . . . . . . . . . . . . . . . . . . . . (2)(1)(2)
Total investment income, net. . . . . . . . . . . . . . . . . . . . . . . . . . . . . $ 38 $ 37 $ 52
Interest income primarily consists of interest income generated from cash, cash equivalents, investment securities
available-for-sale and investment securities held-to-maturity.
Note 6. Prepaid Expenses and Other Assets
Prepaid expenses and other current assets consisted of the following at December 31:
2013 2012
(in millions)
Customer and merchant incentives . . . . . . . . . . . . . . . . . . . . . . . . . . . . . . . . . . . . . . $ 239 $ 222
Investment securities held-to-maturity . . . . . . . . . . . . . . . . . . . . . . . . . . . . . . . . . . . — 36
Prepaid income taxes . . . . . . . . . . . . . . . . . . . . . . . . . . . . . . . . . . . . . . . . . . . . . . . . 36 77
Income taxes receivable . . . . . . . . . . . . . . . . . . . . . . . . . . . . . . . . . . . . . . . . . . . . . . 4 163
Other . . . . . . . . . . . . . . . . . . . . . . . . . . . . . . . . . . . . . . . . . . . . . . . . . . . . . . . . . . . . . 192 183
Total prepaid expenses and other current assets . . . . . . . . . . . . . . . . . . . . . . . . . . . . $ 471 $ 681