MasterCard 2013 Annual Report Download - page 42
Download and view the complete annual report
Please find page 42 of the 2013 MasterCard annual report below. You can navigate through the pages in the report by either clicking on the pages listed below, or by using the keyword search tool below to find specific information within the annual report.-
 1
1 -
2
-
3
-
4
-
5
-
6
-
7
-
8
-
9
-
10
-
11
-
12
-
13
-
14
-
15
-
16
-
17
-
18
-
19
-
20
-
21
-
22
-
23
-
24
-
25
-
26
-
27
-
28
-
29
-
30
-
31
-
 32
32 -
 33
33 -
 34
34 -
 35
35 -
 36
36 -
 37
37 -
 38
38 -
 39
39 -
 40
40 -
 41
41 -
 42
42 -
 43
43 -
 44
44 -
 45
45 -
 46
46 -
 47
47 -
 48
48 -
 49
49 -
 50
50 -
 51
51 -
 52
52 -
53
-
54
-
55
-
56
-
57
-
58
-
59
-
60
-
61
-
62
-
63
-
64
-
65
-
66
-
67
-
68
-
69
-
70
-
71
-
72
-
73
-
74
-
75
-
76
-
77
-
78
-
79
-
80
-
81
-
82
-
83
-
84
-
85
-
86
-
87
-
88
-
89
-
90
-
91
-
92
-
93
-
94
-
95
-
96
-
97
-
98
-
99
-
100
-
101
-
102
-
103
-
104
-
105
-
106
-
107
-
108
-
109
-
110
-
111
-
112
-
113
-
114
-
115
-
116
-
117
-
118
-
119
-
120
 |
 |
38
discussion, see Note 18 (Legal and Regulatory Proceedings) to the consolidated financial statements included in Part
II, Item 8 and our risk factor in "Risk Factors - Legal and Regulatory Risks" in Part I, Item 1A of this Report . Further,
information security risks for global payments and technology companies such as MasterCard have significantly
increased in recent years. Although to date we have not experienced any material impacts relating to cyber-attacks or
other information security breaches, there can be no assurance that we will be immune to these risks and not suffer
such losses in the future. See our risk factor in "Risk Factors - Business Risks" in Part I, Item 1A of this Report related
to a failure or breach of our security systems or infrastructure as a result of cyber-attacks.
Impact of Foreign Currency Rates
Our overall operating results can be impacted by changes in foreign currency exchange rates, especially the strengthening
or weakening of the U.S. dollar versus the euro and Brazilian real. The functional currency of MasterCard Europe, our
principal European operating subsidiary, is the euro, and the functional currency of our Brazilian subsidiary is the
Brazilian real. Accordingly, the strengthening or weakening of the U.S. dollar versus the euro and Brazilian real impacts
the translation of our European and Brazilian subsidiaries’ operating results into the U.S. dollar. For 2013 as compared
to 2012, the U.S. dollar strengthened against the Brazilian real but weakened against the euro. For 2012 compared to
2011, the U.S. dollar strengthened against both the euro and the Brazilian real. The net foreign currency impact of
changes in the U.S. dollar average exchange rates against the euro and Brazilian real increased net income in 2013
compared to 2012 by 1 percentage point. Conversely, net income in 2012 was negatively impacted by currency by
approximately 7 percentage points when compared to 2011.
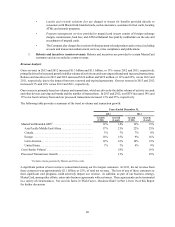
In addition, changes in foreign currency exchange rates directly impact the calculation of gross dollar volume ("GDV")
and gross euro volume (“GEV”), which are used in the calculation of our domestic assessments, cross-border volume
fees and volume related rebates and incentives. In most non-European regions, GDV is calculated based on local
currency spending volume converted to U.S. dollars using average exchange rates for the period. In Europe, GEV is
calculated based on local currency spending volume converted to euros using average exchange rates for the period.
As a result, our domestic assessments, cross-border volume fees and volume related rebates and incentives are impacted
by the strengthening or weakening of the U.S. dollar versus primarily non-European local currencies and the
strengthening or weakening of the euro versus primarily European local currencies. The strengthening or weakening
of the U.S. dollar is evident when GDV growth on a U.S. dollar converted basis is compared to GDV growth on a local
currency basis. In 2013, GDV on a U.S. dollar converted basis increased 12%, versus GDV growth on a local currency
basis of 14%. In 2012, GDV on a U.S. dollar converted basis increased 12%, versus GDV growth on a local currency
basis of 15%. The Company attempts to manage these foreign currency exposures through its foreign exchange risk
management activities, which are discussed further in Note 20 (Foreign Exchange Risk Management) to the consolidated
financial statements included in Part II, Item 8 of this Report.
The Company generates revenue and has financial assets in countries at risk for currency devaluation. While these
revenues and financial assets are not material to MasterCard on a consolidated basis, they could be negatively impacted
if a devaluation of local currencies occurs relative to the U.S. dollar.
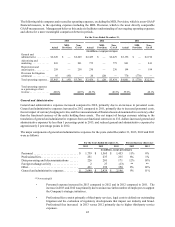
Financial Results
Revenue
Revenue Description
MasterCard’s business model involves four participants in addition to us: cardholders, merchants, issuers (the
cardholders’ financial institutions) and acquirers (the merchants’ financial institutions). Our gross revenue is generated
by assessing our customers based primarily on the dollar volume of activity on the cards and other devices that carry
our brands and from the fees that we charge our customers for providing transaction processing and other payment-
related products and services. Our revenue is based upon transactional information accumulated by our systems or
reported by our customers. Our primary revenue billing currencies are the U.S. dollar, euro and Brazilian real.