MasterCard 2013 Annual Report Download - page 106
Download and view the complete annual report
Please find page 106 of the 2013 MasterCard annual report below. You can navigate through the pages in the report by either clicking on the pages listed below, or by using the keyword search tool below to find specific information within the annual report.-
 1
1 -
2
-
3
-
4
-
5
-
6
-
7
-
8
-
9
-
10
-
11
-
12
-
13
-
14
-
15
-
16
-
17
-
18
-
19
-
20
-
21
-
22
-
23
-
24
-
25
-
26
-
27
-
28
-
29
-
30
-
31
-
32
-
33
-
34
-
35
-
36
-
37
-
38
-
39
-
40
-
41
-
42
-
43
-
44
-
45
-
46
-
47
-
48
-
49
-
50
-
51
-
52
-
53
-
54
-
55
-
56
-
57
-
58
-
59
-
60
-
61
-
62
-
63
-
64
-
65
-
66
-
67
-
68
-
69
-
70
-
71
-
72
-
73
-
74
-
75
-
76
-
77
-
78
-
79
-
80
-
81
-
82
-
83
-
84
-
85
-
86
-
87
-
88
-
89
-
90
-
91
-
92
-
93
-
94
-
95
-
 96
96 -
 97
97 -
 98
98 -
 99
99 -
 100
100 -
 101
101 -
 102
102 -
 103
103 -
 104
104 -
 105
105 -
 106
106 -
 107
107 -
 108
108 -
 109
109 -
 110
110 -
 111
111 -
 112
112 -
 113
113 -
 114
114 -
 115
115 -
 116
116 -
117
-
118
-
119
-
120
 |
 |

102
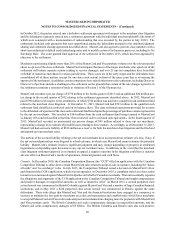
MASTERCARD INCORPORATED
SUMMARY OF QUARTERLY DATA (Unaudited)
2013 Quarter Ended
March 31 June 30 September 30 December 31 2013 Total
(in millions, except per share data)
Net Revenue. . . . . . . . . . . . . . . . . . . . . . . . . . . . $ 1,906 $ 2,096 $ 2,218 $ 2,126 $ 8,346
Operating income. . . . . . . . . . . . . . . . . . . . . . . . 1,107 1,228 1,248 920 4,503
Net income. . . . . . . . . . . . . . . . . . . . . . . . . . . . . 766 848 879 623 3,116
Basic earnings per share1. . . . . . . . . . . . . . . . . . $ 0.63 $ 0.70 $ 0.73 $ 0.52 $ 2.57
Basic weighted-average shares outstanding1. . . 1,226 1,214 1,205 1,201 1,211
Diluted earnings per share1. . . . . . . . . . . . . . . . $ 0.62 $ 0.70 $ 0.73 $ 0.52 $ 2.56
Diluted weighted-average shares outstanding1. 1,230 1,217 1,209 1,205 1,215
2012 Quarter Ended
March 31 June 30 September 30 December 31 2012 Total
(in millions, except per share data)
Net Revenue. . . . . . . . . . . . . . . . . . . . . . . . . . . . $ 1,758 $ 1,820 $ 1,918 $ 1,895 $ 7,391
Operating income. . . . . . . . . . . . . . . . . . . . . . . . 1,000 974 1,064 899 3,937
Net income. . . . . . . . . . . . . . . . . . . . . . . . . . . . . 682 700 772 605 2,759
Basic earnings per share1. . . . . . . . . . . . . . . . . . $ 0.54 $ 0.56 $ 0.62 $ 0.49 $ 2.20
Basic weighted-average shares outstanding1. . . 1,266 1,259 1,247 1,240 1,253
Diluted earnings per share1. . . . . . . . . . . . . . . . $ 0.54 $ 0.56 $ 0.62 $ 0.49 $ 2.19
Diluted weighted-average shares outstanding1. 1,271 1,263 1,251 1,246 1,258
* Tables may not sum due to rounding.
1 The number of shares and per share amounts have been retroactively restated to reflect the ten-for-one stock split of the Company's Class
A and Class B common shares, which was effected in the form of a common stock dividend distributed on January 21, 2014.