MasterCard 2013 Annual Report Download - page 45
Download and view the complete annual report
Please find page 45 of the 2013 MasterCard annual report below. You can navigate through the pages in the report by either clicking on the pages listed below, or by using the keyword search tool below to find specific information within the annual report.-
 1
1 -
2
-
3
-
4
-
5
-
6
-
7
-
8
-
9
-
10
-
11
-
12
-
13
-
14
-
15
-
16
-
17
-
18
-
19
-
20
-
21
-
22
-
23
-
24
-
25
-
26
-
27
-
28
-
29
-
30
-
31
-
32
-
33
-
34
-
 35
35 -
 36
36 -
 37
37 -
 38
38 -
 39
39 -
 40
40 -
 41
41 -
 42
42 -
 43
43 -
 44
44 -
 45
45 -
 46
46 -
 47
47 -
 48
48 -
 49
49 -
 50
50 -
 51
51 -
 52
52 -
 53
53 -
 54
54 -
 55
55 -
56
-
57
-
58
-
59
-
60
-
61
-
62
-
63
-
64
-
65
-
66
-
67
-
68
-
69
-
70
-
71
-
72
-
73
-
74
-
75
-
76
-
77
-
78
-
79
-
80
-
81
-
82
-
83
-
84
-
85
-
86
-
87
-
88
-
89
-
90
-
91
-
92
-
93
-
94
-
95
-
96
-
97
-
98
-
99
-
100
-
101
-
102
-
103
-
104
-
105
-
106
-
107
-
108
-
109
-
110
-
111
-
112
-
113
-
114
-
115
-
116
-
117
-
118
-
119
-
120
 |
 |

41
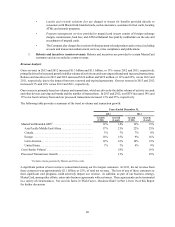
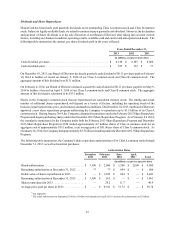
The significant components of our net revenue for the years ended December 31, 2013, 2012 and 2011 were as follows:
For the Years Ended December 31, Percent Increase (Decrease)
2013 20121201112013 2012
(in millions, except percentages)
Domestic assessments . . . . . . . . . . . . . . . . . . . . . $ 3,805 $ 3,494 $ 3,170 9% 10%
Cross-border volume fees. . . . . . . . . . . . . . . . . . . 2,793 2,343 2,094 19% 12%
Transaction processing fees . . . . . . . . . . . . . . . . . 3,359 3,017 2,595 11% 16%
Other revenues . . . . . . . . . . . . . . . . . . . . . . . . . . . 1,331 1,154 1,000 15% 15%
Gross revenue. . . . . . . . . . . . . . . . . . . . . . . . . . . . 11,288 10,008 8,859 13% 13%
Rebates and incentives (contra-revenue) . . . . . . . (2,942) (2,617) (2,145) 12% 22%
Net revenue . . . . . . . . . . . . . . . . . . . . . . . . . . . . . $ 8,346 $ 7,391 $ 6,714 13% 10%
1 Certain prior period amounts have been reclassified to conform to the 2013 presentation. Net revenue is not impacted.
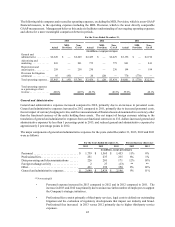
The following table summarizes the primary drivers of net revenue growth in 2013 and 2012:
For the Years Ended December 31,
Volume Pricing Foreign
Currency1Other Total Growth
2013 2012 2013 2012 2013 2012 2013 2012 2013 2012 2
Domestic assessments . . . . . . 13% 14% — % 2% — % (3)% (4)%3(3)%39% 10%
Cross-border volume fees . . . 14% 15% 7 % 2% 1 % (3)% (3)% (2)% 19% 12%
Transaction processing fees. . 11% 21% — % 3% — % (3)% — % (5)% 11% 16%
Other revenues. . . . . . . . . . . . ** ** 4 % 4% 1 % (3)% 10 %414 %415% 15%
Rebates and incentives . . . . . 8% 10% (2)% 1% — % (3)% 6 %514 %512% 22%
Net revenue . . . . . . . . . . . . . . 12% 14% 4 % 3% — % (3)% (3)% (4)% 13% 10%
** Not applicable
1 Reflects translation from the euro and Brazilian real to the U.S. dollar.
2 Certain prior period amounts have been reclassified to conform to the 2013 presentation. Net revenue is not impacted.
3 Includes impact of the allocation of revenue to service deliverables which are recorded in other revenue when services are performed.
4 Positively impacted by acquisitions, consulting fees, fraud service fees and other payment-related products and services.
5 Rebates and incentives, other includes the impact from new, renewed and expired agreements.
Operating Expenses
Our operating expenses are comprised of general and administrative, advertising and marketing, depreciation and
amortization expenses, and the respective amounts recorded for the MDL Provision. Operating expenses increased in
2013 by $389 million, or 11%, primarily due to higher general and administrative expenses and the $95 million portion
of the MDL Provision recorded in 2013. Operating expenses decreased in 2012 by $547 million, or 14% compared to
2011, primarily due to the $770 million portion of the MDL Provision recorded in 2011 (versus the $20 million portion
of the MDL Provision recorded in 2012). Excluding the impact of the MDL Provision, operating expenses increased
$314 million, or 9%, in 2013 compared to 2012 and increased $203 million, or 6%, in 2012 compared to 2011.