MasterCard 2013 Annual Report Download - page 41
Download and view the complete annual report
Please find page 41 of the 2013 MasterCard annual report below. You can navigate through the pages in the report by either clicking on the pages listed below, or by using the keyword search tool below to find specific information within the annual report.-
 1
1 -
2
-
3
-
4
-
5
-
6
-
7
-
8
-
9
-
10
-
11
-
12
-
13
-
14
-
15
-
16
-
17
-
18
-
19
-
20
-
21
-
22
-
23
-
24
-
25
-
26
-
27
-
28
-
29
-
30
-
 31
31 -
 32
32 -
 33
33 -
 34
34 -
 35
35 -
 36
36 -
 37
37 -
 38
38 -
 39
39 -
 40
40 -
 41
41 -
 42
42 -
 43
43 -
 44
44 -
 45
45 -
 46
46 -
 47
47 -
 48
48 -
 49
49 -
 50
50 -
 51
51 -
52
-
53
-
54
-
55
-
56
-
57
-
58
-
59
-
60
-
61
-
62
-
63
-
64
-
65
-
66
-
67
-
68
-
69
-
70
-
71
-
72
-
73
-
74
-
75
-
76
-
77
-
78
-
79
-
80
-
81
-
82
-
83
-
84
-
85
-
86
-
87
-
88
-
89
-
90
-
91
-
92
-
93
-
94
-
95
-
96
-
97
-
98
-
99
-
100
-
101
-
102
-
103
-
104
-
105
-
106
-
107
-
108
-
109
-
110
-
111
-
112
-
113
-
114
-
115
-
116
-
117
-
118
-
119
-
120
 |
 |

37
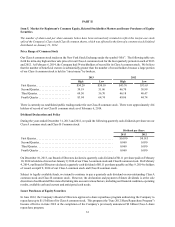
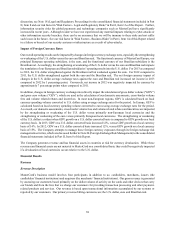
The following table provides a summary of our operating results for the years ended December 31, 2013, 2012 and
2011:
For the Years Ended December 31, Percent Increase (Decrease)
2013 2012 2011 2013 2012
(in millions, except per share data and percentages)
Net revenue . . . . . . . . . . . . . . . . . . . . . . . . . . . . . $ 8,346 $ 7,391 $ 6,714 13% 10%
Operating expenses . . . . . . . . . . . . . . . . . . . . . . . 3,843 3,454 4,001 11% (14)%
Operating income. . . . . . . . . . . . . . . . . . . . . . . . . 4,503 3,937 2,713 14% 45%
Operating margin . . . . . . . . . . . . . . . . . . . . . . . . . 54.0% 53.3% 40.4% ** **
Income tax expense . . . . . . . . . . . . . . . . . . . . . . . 1,384 1,174 842 18% 40%
Effective income tax rate . . . . . . . . . . . . . . . . . . . 30.8% 29.9% 30.6% ** **
Net income . . . . . . . . . . . . . . . . . . . . . . . . . . . . . . $ 3,116 $ 2,759 $ 1,906 13% 45%
Diluted earnings per share . . . . . . . . . . . . . . . . . . $ 2.56 $ 2.19 $ 1.48 17% 48%
Diluted weighted-average shares outstanding . . . 1,215 1,258 1,284 (3)% (2)%
** Not meaningful.
Business Environment
We process transactions from more than 210 countries and territories and in more than 150 currencies. Net revenue
generated in the United States was 39% of total revenue in both 2013 and 2012, and 40% in 2011. No individual
country, other than the United States, generated more than 10% of total revenue in any such period, but differences in
market growth, economic health, and foreign exchange fluctuations in certain countries can have an impact on the
proportion of revenue generated outside the United States over time. While the global nature of our business helps
protect our operating results from adverse economic conditions in a single or a few countries, the significant
concentration of our revenue generated in the United States makes our business particularly susceptible to adverse
economic conditions in the United States.
The competitive and evolving nature of the global payments industry provides both challenges to and opportunities for
the continued growth of our business. Adverse economic events (including continued distress in the credit environment,
continued equity market volatility and additional government intervention) have impacted the financial markets around
the world. The economies of the United States and numerous countries around the world have been significantly
impacted by this economic turmoil. Countries have experienced credit ratings actions by ratings agencies, including
several in Europe as well as the United States. In addition, some existing customers have been placed in receivership
or administration or have a significant amount of their stock owned by their governments. Many financial institutions
are facing increased regulatory and governmental influence, including potential further changes in laws and regulations.
Many of our financial institution customers, merchants that accept our brands and cardholders who use our brands have
been directly and adversely impacted.
MasterCard’s financial results may be negatively impacted by actions taken by individual financial institutions or by
governmental or regulatory bodies. In addition, further political instability or a decline in economic conditions in the
countries in which the Company operates may accelerate the timing of or increase the impact of risks to our financial
performance. As a result, our revenue may be negatively impacted, or the Company may be impacted in several ways.
MasterCard continues to monitor political and economic conditions around the world to identify opportunities for the
continued growth of our business and to evaluate the evolution of the global payments industry. Notwithstanding recent
encouraging trends, the extent and pace of economic recovery in various regions remains uncertain and the overall
business environment may present challenges for MasterCard to grow its business. For a full discussion see "Risk
Factors - Business Risk" in Part I, Item 1A of this Report.
In addition, our business and our customers’ businesses are subject to regulation in many countries. Regulatory bodies
may seek to impose rules and price controls on certain aspects of our business and the payments industry. For further