MasterCard 2013 Annual Report Download - page 105
Download and view the complete annual report
Please find page 105 of the 2013 MasterCard annual report below. You can navigate through the pages in the report by either clicking on the pages listed below, or by using the keyword search tool below to find specific information within the annual report.-
 1
1 -
2
-
3
-
4
-
5
-
6
-
7
-
8
-
9
-
10
-
11
-
12
-
13
-
14
-
15
-
16
-
17
-
18
-
19
-
20
-
21
-
22
-
23
-
24
-
25
-
26
-
27
-
28
-
29
-
30
-
31
-
32
-
33
-
34
-
35
-
36
-
37
-
38
-
39
-
40
-
41
-
42
-
43
-
44
-
45
-
46
-
47
-
48
-
49
-
50
-
51
-
52
-
53
-
54
-
55
-
56
-
57
-
58
-
59
-
60
-
61
-
62
-
63
-
64
-
65
-
66
-
67
-
68
-
69
-
70
-
71
-
72
-
73
-
74
-
75
-
76
-
77
-
78
-
79
-
80
-
81
-
82
-
83
-
84
-
85
-
86
-
87
-
88
-
89
-
90
-
91
-
92
-
93
-
94
-
 95
95 -
 96
96 -
 97
97 -
 98
98 -
 99
99 -
 100
100 -
 101
101 -
 102
102 -
 103
103 -
 104
104 -
 105
105 -
 106
106 -
 107
107 -
 108
108 -
 109
109 -
 110
110 -
 111
111 -
 112
112 -
 113
113 -
 114
114 -
 115
115 -
116
-
117
-
118
-
119
-
120
 |
 |

MASTERCARD INCORPORATED
NOTES TO CONSOLIDATED FINANCIAL STATEMENTS – (Continued)
101
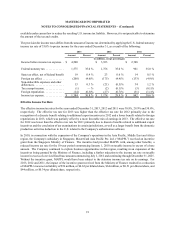
could result in a fair value loss of approximately $189 million on the Company's foreign currency derivative contracts
outstanding at December 31, 2013 related to the hedging program. Counterparty credit risk is the risk of loss due to
failure of the counterparty to perform its obligations in accordance with contractual terms. To mitigate counterparty
credit risk, the Company enters into derivative contracts with selected financial institutions based upon their credit
ratings and other factors. Generally, the Company does not obtain collateral related to derivatives because of the high
credit ratings of the counterparties.
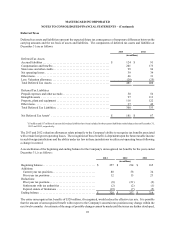
Note 21. Segment Reporting
MasterCard has concluded it has one operating and reportable segment, “Payment Solutions.” MasterCard's President
and Chief Executive Officer has been identified as the chief operating decision-maker. All of the Company’s activities
are interrelated, and each activity is dependent upon and supportive of the other. Accordingly, all significant operating
decisions are based upon analysis of MasterCard at the consolidated level.
Revenue by geographic market is based on the location of the Company's customer that issued the card, as well as the
location of the merchant acquirer where the card is being used. Revenue generated in the U.S. was approximately 39%,
39%, and 40% of net revenue in 2013, 2012 and 2011, respectively. No individual country, other than the U.S., generated
more than 10% of total revenue in those periods.
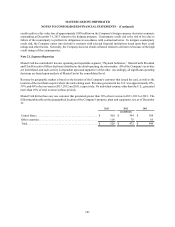
MasterCard did not have any one customer that generated greater than 10% of net revenue in 2013, 2012 or 2011. The
following table reflects the geographical location of the Company's property, plant and equipment, net, as of December
31:
2013 2012 2011
(in millions)
United States . . . . . . . . . . . . . . . . . . . . . . . . . . . . . . . . . . . . . . . . . . $ 410 $ 394 $ 384
Other countries. . . . . . . . . . . . . . . . . . . . . . . . . . . . . . . . . . . . . . . . . 116 78 65
Total. . . . . . . . . . . . . . . . . . . . . . . . . . . . . . . . . . . . . . . . . . . . . . . . . $ 526 $ 472 $ 449