MasterCard 2013 Annual Report Download - page 40
Download and view the complete annual report
Please find page 40 of the 2013 MasterCard annual report below. You can navigate through the pages in the report by either clicking on the pages listed below, or by using the keyword search tool below to find specific information within the annual report.-
 1
1 -
2
-
3
-
4
-
5
-
6
-
7
-
8
-
9
-
10
-
11
-
12
-
13
-
14
-
15
-
16
-
17
-
18
-
19
-
20
-
21
-
22
-
23
-
24
-
25
-
26
-
27
-
28
-
29
-
 30
30 -
 31
31 -
 32
32 -
 33
33 -
 34
34 -
 35
35 -
 36
36 -
 37
37 -
 38
38 -
 39
39 -
 40
40 -
 41
41 -
 42
42 -
 43
43 -
 44
44 -
 45
45 -
 46
46 -
 47
47 -
 48
48 -
 49
49 -
 50
50 -
51
-
52
-
53
-
54
-
55
-
56
-
57
-
58
-
59
-
60
-
61
-
62
-
63
-
64
-
65
-
66
-
67
-
68
-
69
-
70
-
71
-
72
-
73
-
74
-
75
-
76
-
77
-
78
-
79
-
80
-
81
-
82
-
83
-
84
-
85
-
86
-
87
-
88
-
89
-
90
-
91
-
92
-
93
-
94
-
95
-
96
-
97
-
98
-
99
-
100
-
101
-
102
-
103
-
104
-
105
-
106
-
107
-
108
-
109
-
110
-
111
-
112
-
113
-
114
-
115
-
116
-
117
-
118
-
119
-
120
 |
 |
36
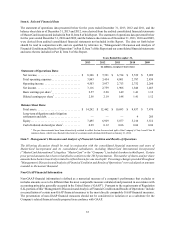
MasterCard presents non-GAAP financial measures to enhance an investor's evaluation of MasterCard's ongoing
operating results and to facilitate meaningful comparison of its results between periods. MasterCard's management
uses these non-GAAP financial measures to, among other things, evaluate its ongoing operations in relation to historical
results, for internal planning and forecasting purposes and in the calculation of performance-based compensation. More
specifically, the following non-GAAP financial measures are presented in Management’s Discussion and Analysis of
Financial Condition and Results of Operations:
• Total operating expenses excluding the provisions recorded in 2013 ($95 million), 2012 ($20 million) and
2011 ($770 million) for settlements relating to U.S. merchant litigations (collectively referred to as the “MDL
Provision”). MasterCard excluded these items because MasterCard's management monitors provisions for
material litigation settlements separately from ongoing operations and evaluates ongoing performance without
these amounts. See "Operating Expenses" for the table that provides a reconciliation of operating expenses
excluding the MDL Provision to the most directly comparable GAAP measure.
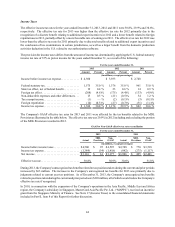
• Effective income tax rate excluding the 2013 and 2011 portions of the MDL Provision. MasterCard excluded
these items because MasterCard's management monitors provisions for material litigation settlements
separately from ongoing operations and evaluates ongoing performance without these amounts. See "Income
Taxes" for the table that provides a reconciliation of the effective income tax rate excluding the 2013 and 2011
portions of the MDL Provision to the most directly comparable GAAP measure.
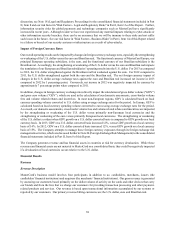
Overview
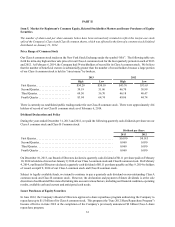
We recorded net income of $3.1 billion, or $2.56 per diluted share in 2013 versus net income of $2.8 billion, or $2.19
per diluted share in 2012, and net income of $1.9 billion, or $1.48 per diluted share in 2011. Our 2011 net income was
significantly impacted by the $770 million portion of the MDL Provision ($495 million after tax) recorded in 2011. In
2013 and 2012, the Company increased the provision by $95 million ($61 million after tax) and $20 million ($13 million
after tax), respectively.
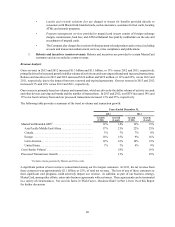
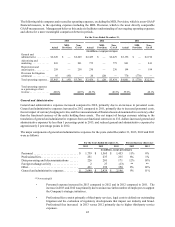
Our net revenue increased 13% and 10% in 2013 and 2012, primarily driven by increased growth in dollar volume of
activity on cards carrying our brands and the number of transactions processed by the Company. In 2013 and 2012,
both volume-based revenue (domestic assessments and cross-border volume fees) and transaction-based revenue
(transaction processing fees) increased compared to 2012 by 12% and 13%, respectively. In 2013 and 2012, our
processed transactions increased 13% and 25% versus the comparable periods in 2012 and 2011, respectively. In 2013
and 2012, our volumes increased 14% and 15%, on a local currency basis, versus the comparable periods in 2012 and
2011, respectively. Rebates and incentives as a percentage of gross revenue were 26% in both 2013 and 2012, and
24% in 2011.
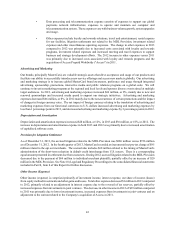
Operating expenses in 2013 increased $389 million, or 11%, from 2012 and decreased $547 million, or 14%, in 2012
from 2011 primarily due to the 2011 portion of the MDL Provision. We generated net cash flows from operations of
$4.1 billion for the year ended December 31, 2013, compared to $2.9 billion and $2.7 billion for the years ended
December 31, 2012 and 2011, respectively.