Lexmark 2008 Annual Report Download - page 94
Download and view the complete annual report
Please find page 94 of the 2008 Lexmark annual report below. You can navigate through the pages in the report by either clicking on the pages listed below, or by using the keyword search tool below to find specific information within the annual report.-
 1
1 -
2
-
3
-
4
-
5
-
6
-
7
-
8
-
9
-
10
-
11
-
12
-
13
-
14
-
15
-
16
-
17
-
18
-
19
-
20
-
21
-
22
-
23
-
24
-
25
-
26
-
27
-
28
-
29
-
30
-
31
-
32
-
33
-
34
-
35
-
36
-
37
-
38
-
39
-
40
-
41
-
42
-
43
-
44
-
45
-
46
-
47
-
48
-
49
-
50
-
51
-
52
-
53
-
54
-
55
-
56
-
57
-
58
-
59
-
60
-
61
-
62
-
63
-
64
-
65
-
66
-
67
-
68
-
69
-
70
-
71
-
72
-
73
-
74
-
75
-
76
-
77
-
78
-
79
-
80
-
81
-
82
-
83
-
 84
84 -
 85
85 -
 86
86 -
 87
87 -
 88
88 -
 89
89 -
 90
90 -
 91
91 -
 92
92 -
 93
93 -
 94
94 -
 95
95 -
 96
96 -
 97
97 -
 98
98 -
 99
99 -
 100
100 -
 101
101 -
 102
102 -
 103
103 -
 104
104 -
105
-
106
-
107
-
108
-
109
-
110
-
111
-
112
-
113
-
114
-
115
-
116
-
117
-
118
-
119
-
120
-
121
-
122
-
123
-
124
 |
 |

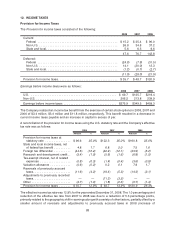
12. INCOME TAXES
Provision for Income Taxes
The Provision for income taxes consisted of the following:
2008 2007 2006
Current:
Federal . . . . . . . . . . . . . . . . . . . . . . . . . . . . . . . . . . . . . . . . . . . . . . . $ 15.2 $ 35.4 $ 96.0
Non-U.S. . . . . . . . . . . . . . . . . . . . . . . . . . . . . . . . . . . . . . . . . . . . . . . 26.8 34.8 37.2
State and local . . . . . . . . . . . . . . . . . . . . . . . . . . . . . . . . . . . . . . . . . . 5.6 6.5 9.6
47.6 76.7 142.8
Deferred:
Federal . . . . . . . . . . . . . . . . . . . . . . . . . . . . . . . . . . . . . . . . . . . . . . . (24.8) (7.9) (31.5)
Non-U.S. . . . . . . . . . . . . . . . . . . . . . . . . . . . . . . . . . . . . . . . . . . . . . . 14.1 (20.0) 12.3
State and local . . . . . . . . . . . . . . . . . . . . . . . . . . . . . . . . . . . . . . . . . . (1.2) (0.1) (2.7)
(11.9) (28.0) (21.9)
Provision for income taxes. . . . . . . . . . . . . . . . . . . . . . . . . . . . . . . . . . . $ 35.7 $ 48.7 $120.9
Earnings before income taxes were as follows:
2008 2007 2006
U.S. . . . . . . . . . . . . . . . . . . . . . . . . . . . . . . . . . . . . . . . . . . . . . . . . . . $ 69.7 $135.7 $219.4
Non-U.S. . . . . . . . . . . . . . . . . . . . . . . . . . . . . . . . . . . . . . . . . . . . . . . . 206.2 213.8 239.9
Earnings before income taxes . . . . . . . . . . . . . . . . . . . . . . . . . . . . . . . $275.9 $349.5 $459.3
The Company realized an income tax benefit from the exercise of certain stock options in 2008, 2007 and
2006 of $3.4 million, $3.4 million and $11.8 million, respectively. This benefit resulted in a decrease in
current income taxes payable and an increase in capital in excess of par.
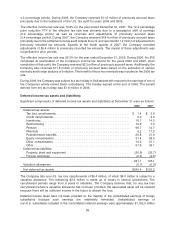
A reconciliation of the provision for income taxes using the U.S. statutory rate and the Company’s effective
tax rate was as follows:
Amount % Amount % Amount %
2008 2007 2006
Provision for income taxes at
statutory rate . . . . . . . . . . . . . . . $ 96.6 35.0% $122.3 35.0% $160.8 35.0%
State and local income taxes, net
of federal tax benefit . . . . . . . . . . 4.8 1.7 6.8 2.0 7.5 1.6
Foreign tax differential . . . . . . . . . . (44.6) (16.2) (42.2) (12.1) (23.9) (5.2)
Research and development credit. . (5.4) (1.9) (5.6) (1.6) (6.8) (1.5)
Tax-exempt interest, net of related
expenses . . . . . . . . . . . . . . . . . . (0.8) (0.3) (1.4) (0.4) (3.6) (0.8)
Valuation allowance . . . . . . . . . . . . (0.6) (0.2) 0.2 0.1 7.9 1.7
Reversals of previously accrued
taxes. . . . . . . . . . . . . . . . . . . . . . (11.6) (4.2) (18.4) (5.3) (14.3) (3.1)
Adjustments to previously recorded
taxes. . . . . . . . . . . . . . . . . . . . . . — — (11.2) (3.2) ——
Other . . . . . . . . . . . . . . . . . . . . . . . (2.7) (1.0) (1.8) (0.6) (6.7) (1.4)
Provision for income taxes . . . . . . . $ 35.7 12.9% $ 48.7 13.9% $120.9 26.3%
The effective income tax rate was 12.9% for the year ended December 31, 2008. The 1.0 percentage point
reduction of the effective tax rate from 2007 to 2008 was due to a reduction of 5.3 percentage points,
primarily related to the geographic shift in earnings along with a variety of other factors, partially offset by a
smaller amount of reversals and adjustments to previously accrued taxes in 2008 (increase of
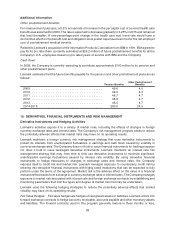
88