Lexmark 2008 Annual Report Download - page 54
Download and view the complete annual report
Please find page 54 of the 2008 Lexmark annual report below. You can navigate through the pages in the report by either clicking on the pages listed below, or by using the keyword search tool below to find specific information within the annual report.-
 1
1 -
2
-
3
-
4
-
5
-
6
-
7
-
8
-
9
-
10
-
11
-
12
-
13
-
14
-
15
-
16
-
17
-
18
-
19
-
20
-
21
-
22
-
23
-
24
-
25
-
26
-
27
-
28
-
29
-
30
-
31
-
32
-
33
-
34
-
35
-
36
-
37
-
38
-
39
-
40
-
41
-
42
-
43
-
 44
44 -
 45
45 -
 46
46 -
 47
47 -
 48
48 -
 49
49 -
 50
50 -
 51
51 -
 52
52 -
 53
53 -
 54
54 -
 55
55 -
 56
56 -
 57
57 -
 58
58 -
 59
59 -
 60
60 -
 61
61 -
 62
62 -
 63
63 -
 64
64 -
65
-
66
-
67
-
68
-
69
-
70
-
71
-
72
-
73
-
74
-
75
-
76
-
77
-
78
-
79
-
80
-
81
-
82
-
83
-
84
-
85
-
86
-
87
-
88
-
89
-
90
-
91
-
92
-
93
-
94
-
95
-
96
-
97
-
98
-
99
-
100
-
101
-
102
-
103
-
104
-
105
-
106
-
107
-
108
-
109
-
110
-
111
-
112
-
113
-
114
-
115
-
116
-
117
-
118
-
119
-
120
-
121
-
122
-
123
-
124
 |
 |

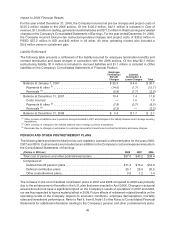
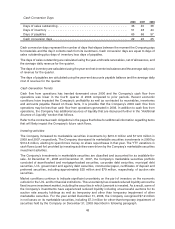
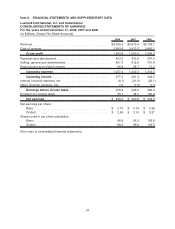
Cash Conversion Days
2008 2007 2006
Days of sales outstanding . . . . . . . . . . . . . . . . . . . . . . . . . . . . . . . . . . . . . . . . . 36 40 38
Days of inventory . . . . . . . . . . . . . . . . . . . . . . . . . . . . . . . . . . . . . . . . . . . . . . . 51 48 44
Days of payables . . . . . . . . . . . . . . . . . . . . . . . . . . . . . . . . . . . . . . . . . . . . . . . 65 66 57
Cash conversion days . . . . . . . . . . . . . . . . . . . . . . . . . . . . . . . . . . . . . . . . . . . . 22 22 25
Cash conversion days represent the number of days that elapse between the moment the Company pays
for materials and the day it collects cash from its customers. Cash conversion days are equal to days of
sales outstanding plus days of inventory less days of payables.
The days of sales outstanding are calculated using the year-end trade receivables, net of allowances, and
the average daily revenue for the quarter.
The days of inventory are calculated using the year-end net inventories balance and the average daily cost
of revenue for the quarter.
The days of payables are calculated using the year-end accounts payable balance and the average daily
cost of revenue for the quarter.
Cash Generation Trends
Cash flow from operations has trended downward since 2006 and the Company’s cash flow from
operations was lower in the fourth quarter of 2008 compared to prior periods. Recent economic
conditions have impacted the Company’s profitability as well as contracted its receivables, inventories
and accounts payable. Based on these facts, it is possible that the Company’s 2009 cash flow from
operations may be less than cash flow from operations generated in 2008. In addition to cash flow from
operations, the Company has additional sources of liquidity that are discussed further in the “Additional
Sources of Liquidity” section that follows.
Refer to the contractual cash obligations in the pages that follow for additional information regarding items
that will likely impact the Company’s future cash flows.
Investing activities
The Company increased its marketable securities investments by $210.6 million and $112.9 million in
2008 and 2007, respectively. The Company decreased its marketable securities investments in 2006 by
$314.8 million, electing to spend more money on share repurchases in that year. The YTY variations in
cash flows (used for) provided by investing activities were driven by the Company’s marketable securities
investment activities.
The Company’s investments in marketable securities are classified and accounted for as available-for-
sale. At December 31, 2008 and December 31, 2007, the Company’s marketable securities portfolio
consisted of asset-backed and mortgage-backed securities, corporate debt securities, municipal debt
securities, U.S. government and agency debt securities, commercial paper, certificates of deposit and
preferred securities, including approximately $25 million and $79 million, respectively, of auction rate
securities.
Market conditions continue to indicate significant uncertainty on the part of investors on the economic
outlook for the U.S. and for financial institutions. This uncertainty has created reduced liquidity across the
fixed income investment market, including the securities in which Lexmark is invested. As a result, some of
the Company’s investments have experienced reduced liquidity including unsuccessful auctions for its
auction rate security holdings as well as temporary and other than temporary impairment of other
marketable securities. For the year ended December 31, 2008, the Company recognized $7.9 million
in net losses on its marketable securities, including $7.3 million for other-than-temporary impairment of
securities held by the Company on December 31, 2008 described in following paragraph.
48