Lexmark 2008 Annual Report Download - page 40
Download and view the complete annual report
Please find page 40 of the 2008 Lexmark annual report below. You can navigate through the pages in the report by either clicking on the pages listed below, or by using the keyword search tool below to find specific information within the annual report.-
 1
1 -
2
-
3
-
4
-
5
-
6
-
7
-
8
-
9
-
10
-
11
-
12
-
13
-
14
-
15
-
16
-
17
-
18
-
19
-
20
-
21
-
22
-
23
-
24
-
25
-
26
-
27
-
28
-
29
-
 30
30 -
 31
31 -
 32
32 -
 33
33 -
 34
34 -
 35
35 -
 36
36 -
 37
37 -
 38
38 -
 39
39 -
 40
40 -
 41
41 -
 42
42 -
 43
43 -
 44
44 -
 45
45 -
 46
46 -
 47
47 -
 48
48 -
 49
49 -
 50
50 -
51
-
52
-
53
-
54
-
55
-
56
-
57
-
58
-
59
-
60
-
61
-
62
-
63
-
64
-
65
-
66
-
67
-
68
-
69
-
70
-
71
-
72
-
73
-
74
-
75
-
76
-
77
-
78
-
79
-
80
-
81
-
82
-
83
-
84
-
85
-
86
-
87
-
88
-
89
-
90
-
91
-
92
-
93
-
94
-
95
-
96
-
97
-
98
-
99
-
100
-
101
-
102
-
103
-
104
-
105
-
106
-
107
-
108
-
109
-
110
-
111
-
112
-
113
-
114
-
115
-
116
-
117
-
118
-
119
-
120
-
121
-
122
-
123
-
124
 |
 |

• Its sales were too skewed to the low-end versus the market, resulting in lower supplies generation
per unit.
As a result, Lexmark took the following actions:
• The Company decided to more aggressively shift its focus to geographic regions, market segments
and customers that generate higher page usage.
• The Company worked to minimize the unit sales that did not generate an acceptable profit over their
life.
Additionally, to improve the Company’s cost and expense structure, the Company announced a
restructuring plan (“the 2007 Restructuring Plan”) to reduce its cost and infrastructure, including the
closure of one of its inkjet supplies manufacturing facilities in Mexico and additional optimization measures
at the remaining inkjet facilities in Mexico and the Philippines. See “Restructuring and Related Charges
(Reversals) and Project Costs” that follows for further discussion.
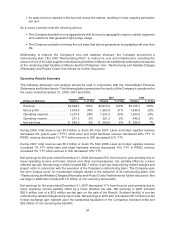
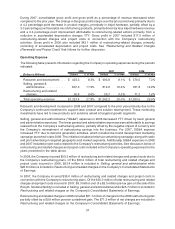
Operating Results Summary
The following discussion and analysis should be read in conjunction with the Consolidated Financial
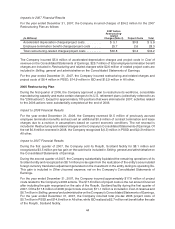
Statements and Notes thereto. The following table summarizes the results of the Company’s operations for
the years ended December 31, 2008, 2007 and 2006:
(Dollars in Millions) Dollars % of Rev Dollars % of Rev Dollars % of Rev
2008 2007 2006
Revenue. . . . . . . . . . . . . . . . . . $4,528.4 100% $4,973.9 100% $5,108.1 100%
Gross profit . . . . . . . . . . . . . . . 1,534.6 34% 1,563.6 31% 1,646.0 32%
Operating expense . . . . . . . . . . 1,257.4 28% 1,242.3 25% 1,203.5 24%
Operating income . . . . . . . . . . . 277.2 6% 321.3 6% 442.5 9%
Net earnings. . . . . . . . . . . . . . . $ 240.2 5% $ 300.8 6% $ 338.4 7%
During 2008, total revenue was $4.5 billion or down 9% from 2007. Laser and inkjet supplies revenue
decreased 4% year-to-year (“YTY”) while laser and inkjet hardware revenue decreased 20% YTY. In
PSSD, revenue decreased 1% YTY while revenue in ISD decreased 22% YTY.
During 2007, total revenue was $5.0 billion or down 3% from 2006. Laser and inkjet supplies revenue
increased 1% YTY while laser and inkjet hardware revenue decreased 10% YTY. In PSSD, revenue
increased 5% YTY while revenue in ISD decreased 12% YTY.
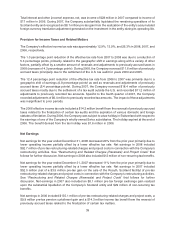
Net earnings for the year ended December 31, 2008 decreased 20% from the prior year primarily due to
lower operating income and lower interest and other income/expense, net, partially offset by a lower
effective tax rate. Net earnings in 2008 included $92.7 million of pre-tax restructuring-related charges and
project costs in connection with the execution of the Company’s restructuring plans. The Company uses
the term “project costs” for incremental charges related to the execution of its restructuring plans. See
“Restructuring and Related Charges (Reversals) and Project Costs” that follows for further discussion. Net
earnings in 2008 also included $11.6 million of non-recurring tax benefits.
Net earnings for the year ended December 31, 2007 decreased 11% from the prior year primarily due to
lower operating income partially offset by a lower effective tax rate. Net earnings in 2007 included
$52.0 million (net of a $3.5 million pre-tax gain on the sale of the Rosyth, Scotland facility) of pre-tax
restructuring-related charges and project costs. Net earnings in 2007 also included an $8.1 million pre-tax
foreign exchange gain realized upon the substantial liquidation of the Company’s Scotland entity and
$29 million of non-recurring tax benefits.
34