Lexmark 2008 Annual Report Download - page 43
Download and view the complete annual report
Please find page 43 of the 2008 Lexmark annual report below. You can navigate through the pages in the report by either clicking on the pages listed below, or by using the keyword search tool below to find specific information within the annual report.
During 2007, consolidated gross profit and gross profit as a percentage of revenue decreased when
compared to the prior year. The change in the gross profit margin over the prior period was primarily due to
a 4.2 percentage point decrease in product margins, principally in inkjet hardware, partially offset by a
3.0 percentage point favorable mix shift among products, primarily driven by less inkjet hardware revenue
and a 0.4 percentage point improvement attributable to restructuring-related actions primarily from a
reduction in accelerated depreciation charges YTY. Gross profit in 2007 included $17.0 million of
restructuring-related charges and project costs in connection with the Company’s restructuring
activities. Gross profit in 2006 also included $42.1 million of restructuring-related charges, primarily
consisting of accelerated depreciation and project costs. See “Restructuring and Related Charges
(Reversals) and Project Costs” that follows for further discussion.
Operating Expense
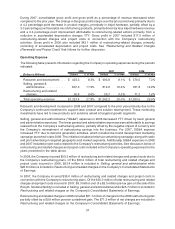
The following table presents information regarding the Company’s operating expenses during the periods
indicated:
(Dollars in Millions) Dollars % of Rev Dollars % of Rev Dollars % of Rev
2008 2007 2006
Research and development . . . $ 423.3 9.3% $ 403.8 8.1% $ 370.5 7.3%
Selling, general &
administrative . . . . . . . . . . . . 807.3 17.9% 812.8 16.4% 761.8 14.9%
Restructuring and related
charges. . . . . . . . . . . . . . . . . 26.8 0.6% 25.7 0.5% 71.2 1.4%
Total operating expense . . . . . . $1,257.4 27.8% $1,242.3 25.0% $1,203.5 23.6%
Research and development increased in 2008 and 2007 compared to the prior year primarily due to the
Company’s continued investment to support laser product and solution development. These continuing
investments have led to new products and solutions aimed at targeted growth segments.
Selling, general and administrative (“SG&A”) expenses in 2008 decreased YTY driven by lower general
and administrative expenses. The lower general and administrative expenses were attributable to savings
realized from the Company’s restructuring actions, partially offset by the negative impact of currency and
the Company’s reinvestment of restructuring savings into the business. For 2007, SG&A expense
increased YTY due to demand generation activities, which included the brand development marketing
campaign launched in late 2006. The initiative included a television advertising campaign along with radio
and print advertising in targeted geographic and market segments. Additionally, SG&A expenses in 2008
and 2007 included project costs related to the Company’s restructuring activities. See discussion below of
restructuring and related charges and project costs included in the Company’s operating expenses for the
years presented in the table above.
In 2008, the Company incurred $50.2 million of restructuring and related charges and project costs due to
the Company’s restructuring plans. Of the $50.2 million of total restructuring and related charges and
project costs incurred in 2008, $23.4 million is included in Selling, general and administrative while
$26.8 million is included in Restructuring and related charges on the Company’s Consolidated Statements
of Earnings.
In 2007, the Company incurred $35.0 million of restructuring and related charges and project costs in
connection with the Company’s restructuring plans. Of the $35.0 million of total restructuring and related
charges and project costs incurred in 2007, $9.3 million (net of a $3.5 million pre-tax gain on the sale of the
Rosyth, Scotland facility) is included in Selling, general and administrative while $25.7 million is included in
Restructuring and related charges on the Company’s Consolidated Statements of Earnings.
Restructuring and related charges in 2006 included $81.1 million of charges for the 2006 restructuring plan
partially offset by a $9.9 million pension curtailment gain. The $71.2 million of net charges are included in
Restructuring and related charges on the Company’s Consolidated Statements of Earnings.
37


