Lexmark 2008 Annual Report Download - page 65
Download and view the complete annual report
Please find page 65 of the 2008 Lexmark annual report below. You can navigate through the pages in the report by either clicking on the pages listed below, or by using the keyword search tool below to find specific information within the annual report.-
 1
1 -
2
-
3
-
4
-
5
-
6
-
7
-
8
-
9
-
10
-
11
-
12
-
13
-
14
-
15
-
16
-
17
-
18
-
19
-
20
-
21
-
22
-
23
-
24
-
25
-
26
-
27
-
28
-
29
-
30
-
31
-
32
-
33
-
34
-
35
-
36
-
37
-
38
-
39
-
40
-
41
-
42
-
43
-
44
-
45
-
46
-
47
-
48
-
49
-
50
-
51
-
52
-
53
-
54
-
 55
55 -
 56
56 -
 57
57 -
 58
58 -
 59
59 -
 60
60 -
 61
61 -
 62
62 -
 63
63 -
 64
64 -
 65
65 -
 66
66 -
 67
67 -
 68
68 -
 69
69 -
 70
70 -
 71
71 -
 72
72 -
 73
73 -
 74
74 -
 75
75 -
76
-
77
-
78
-
79
-
80
-
81
-
82
-
83
-
84
-
85
-
86
-
87
-
88
-
89
-
90
-
91
-
92
-
93
-
94
-
95
-
96
-
97
-
98
-
99
-
100
-
101
-
102
-
103
-
104
-
105
-
106
-
107
-
108
-
109
-
110
-
111
-
112
-
113
-
114
-
115
-
116
-
117
-
118
-
119
-
120
-
121
-
122
-
123
-
124
 |
 |

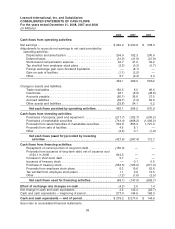
Lexmark International, Inc. and Subsidiaries
CONSOLIDATED STATEMENTS OF CASH FLOWS
For the years ended December 31, 2008, 2007 and 2006
(In Millions)
2008 2007 2006
Cash flows from operating activities:
Net earnings . . . . . . . . . . . . . . . . . . . . . . . . . . . . . . . . . . . . . . . . . . . $ 240.2 $ 300.8 $ 338.4
Adjustments to reconcile net earnings to net cash provided by
operating activities:
Depreciation and amortization . . . . . . . . . . . . . . . . . . . . . . . . . . 204.9 192.3 200.9
Deferred taxes . . . . . . . . . . . . . . . . . . . . . . . . . . . . . . . . . . . . . . (31.0) (31.0) (21.9)
Stock-based compensation expense . . . . . . . . . . . . . . . . . . . . . 32.7 41.2 43.2
Tax shortfall from employee stock plans . . . . . . . . . . . . . . . . . . . (3.3) (0.3) (0.7)
Foreign exchange gain upon Scotland liquidation . . . . . . . . . . . . — (8.1) —
Gain on sale of facilities . . . . . . . . . . . . . . . . . . . . . . . . . . . . . . . (1.1) (3.5) —
Other . . . . . . . . . . . . . . . . . . . . . . . . . . . . . . . . . . . . . . . . . . . . . 6.7 (9.4) 3.3
449.1 482.0 563.2
Change in assets and liabilities:
Trade receivables . . . . . . . . . . . . . . . . . . . . . . . . . . . . . . . . . . . . 150.5 5.5 66.6
Inventories . . . . . . . . . . . . . . . . . . . . . . . . . . . . . . . . . . . . . . . . . 26.1 (6.6) (48.6)
Accounts payable . . . . . . . . . . . . . . . . . . . . . . . . . . . . . . . . . . . . (80.1) 36.6 27.5
Accrued liabilities . . . . . . . . . . . . . . . . . . . . . . . . . . . . . . . . . . . . (39.7) (7.4) 62.0
Other assets and liabilities . . . . . . . . . . . . . . . . . . . . . . . . . . . . . (23.8) 54.1 0.2
Net cash flows provided by operating activities . . . . . . . . . 482.1 564.2 670.9
Cash flows from investing activities:
Purchases of property, plant and equipment . . . . . . . . . . . . . . . . (217.7) (182.7) (200.2)
Purchases of marketable securities . . . . . . . . . . . . . . . . . . . . . . (744.4) (968.2) (1,406.2)
Proceeds from sales/maturities of marketable securities . . . . . . . 533.8 855.3 1,721.0
Proceeds from sale of facilities. . . . . . . . . . . . . . . . . . . . . . . . . . 4.6 8.1 —
Other . . . . . . . . . . . . . . . . . . . . . . . . . . . . . . . . . . . . . . . . . . . . . (3.9) 0.1 (1.9)
Net cash flows (used for) provided by investing
activities . . . . . . . . . . . . . . . . . . . . . . . . . . . . . . . . . . . . . . (427.6) (287.4) 112.7
Cash flows from financing activities:
Repayment of current portion of long term debt . . . . . . . . . . . . . (150.0) — —
Proceeds from issuance of long-term debt, net of issuance cost
of $4.1 in 2008 . . . . . . . . . . . . . . . . . . . . . . . . . . . . . . . . . . . . 644.5 — —
Increase in short-term debt . . . . . . . . . . . . . . . . . . . . . . . . . . . . 5.7 — —
Issuance of treasury stock . . . . . . . . . . . . . . . . . . . . . . . . . . . . . — 0.1 0.5
Purchase of treasury stock . . . . . . . . . . . . . . . . . . . . . . . . . . . . . (554.5) (165.0) (871.0)
Proceeds from employee stock plans . . . . . . . . . . . . . . . . . . . . . 6.3 15.6 52.8
Tax windfall from employee stock plans . . . . . . . . . . . . . . . . . . . 1.1 3.9 12.5
Other . . . . . . . . . . . . . . . . . . . . . . . . . . . . . . . . . . . . . . . . . . . . . (1.2) (1.6) (3.5)
Net cash flows used for financing activities . . . . . . . . . . . . (48.1) (147.0) (808.7)
Effect of exchange rate changes on cash . . . . . . . . . . . . . . . . . . . (4.2) 2.6 1.4
Net change in cash and cash equivalents . . . . . . . . . . . . . . . . . . . . . 2.2 132.4 (23.7)
Cash and cash equivalents — beginning of period . . . . . . . . . . . . . . . 277.0 144.6 168.3
Cash and cash equivalents — end of period . . . . . . . . . . . . . . . . . $ 279.2 $ 277.0 $ 144.6
See notes to consolidated financial statements.
59