Lexmark 2008 Annual Report Download - page 42
Download and view the complete annual report
Please find page 42 of the 2008 Lexmark annual report below. You can navigate through the pages in the report by either clicking on the pages listed below, or by using the keyword search tool below to find specific information within the annual report.-
 1
1 -
2
-
3
-
4
-
5
-
6
-
7
-
8
-
9
-
10
-
11
-
12
-
13
-
14
-
15
-
16
-
17
-
18
-
19
-
20
-
21
-
22
-
23
-
24
-
25
-
26
-
27
-
28
-
29
-
30
-
31
-
 32
32 -
 33
33 -
 34
34 -
 35
35 -
 36
36 -
 37
37 -
 38
38 -
 39
39 -
 40
40 -
 41
41 -
 42
42 -
 43
43 -
 44
44 -
 45
45 -
 46
46 -
 47
47 -
 48
48 -
 49
49 -
 50
50 -
 51
51 -
 52
52 -
53
-
54
-
55
-
56
-
57
-
58
-
59
-
60
-
61
-
62
-
63
-
64
-
65
-
66
-
67
-
68
-
69
-
70
-
71
-
72
-
73
-
74
-
75
-
76
-
77
-
78
-
79
-
80
-
81
-
82
-
83
-
84
-
85
-
86
-
87
-
88
-
89
-
90
-
91
-
92
-
93
-
94
-
95
-
96
-
97
-
98
-
99
-
100
-
101
-
102
-
103
-
104
-
105
-
106
-
107
-
108
-
109
-
110
-
111
-
112
-
113
-
114
-
115
-
116
-
117
-
118
-
119
-
120
-
121
-
122
-
123
-
124
 |
 |

ISD
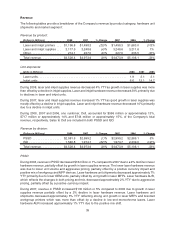
During 2008, revenue in ISD decreased $428 million or 22% compared to 2007 due to decreased inkjet
hardware and supplies revenue. Hardware revenue declined 38% YTY due to lower unit shipments.
Management believes supplies revenue declined YTY due to shrinkage in the installed base of inkjet
products and an associated decline in end-user demand for inkjet supplies. Inkjet hardware unit shipments
declined 45% YTY principally due to the Company’s decision to prioritize certain markets, segments and
customers and to reduce or eliminate others. Units were also impacted by the weakening market and some
lost retail shelf space. Inkjet hardware AUR increased 13% YTY due to favorable product mix shift, partially
offset by a negative impact of pricing.
During 2007, revenue in ISD decreased $264 million or 12% compared to 2006 due to decreased inkjet
hardware and supplies revenue. Hardware revenue declined 20% YTY due to lower unit shipments and
lower AURs. Inkjet hardware unit shipments declined 18% YTY principally due to declines in OEM units
and the Company’s decision to prioritize certain markets, segments and customers and to reduce or
eliminate others. Units were also impacted by the Company’s decision to focus on more profitable printer
placements in every geography. Inkjet hardware AUR decreased 3% YTYas price declines were partially
offset by a favorable mix shift to AIOs.
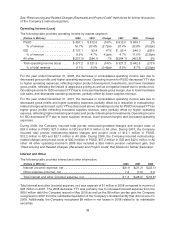
Revenue by geography:
The following table provides a breakdown of the Company’s revenue by geography:
(Dollars in Millions) 2008 % of Total 2007 % of Total % Change 2007 2006 % of Total % Change
United States . . . . . . . . $1,864.8 41% $2,140.3 43% ⫺13% $2,140.3 $2,245.3 44% ⫺5%
EMEA (Europe, the
Middle East &
Africa) . . . . . . . . . . . 1,742.9 39% 1,827.2 37% –5% 1,827.2 1,843.1 36% ⫺1%
Other International . . . . 920.7 20% 1,006.4 20% ⫺9% 1,006.4 1,019.7 20% ⫺1%
Total revenue . . . . . . . . $4,528.4 100% $4,973.9 100% ⫺9% $4,973.9 $5,108.1 100% ⫺3%
During 2008, revenue decreased in all geographies primarily due to lower laser and inkjet hardware
revenue as well as lower inkjet supplies revenue. Currency exchange rates had a 2% favorable impact on
revenue for the year 2008.
During 2007, revenue decreased in all geographies primarily due to the previously-mentioned decline in
ISD revenue. Currency exchange rates had a 4% favorable impact on revenue for the year 2007.
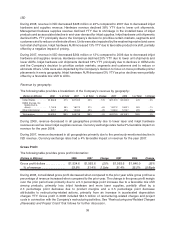
Gross Profit
The following table provides gross profit information:
(Dollars in Millions) 2008 2007 Change 2007 2006 Change
Gross profit dollars . . . . . . . . . . . . $1,534.6 $1,563.6 (2)% $1,563.6 $1,646.0 (5)%
% of revenue .............. 33.9% 31.4% 2.5pts 31.4% 32.2% (0.8)pts
During 2008, consolidated gross profit decreased when compared to the prior year while gross profit as a
percentage of revenue increased when compared to the prior year. The change in the gross profit margin
over the prior period was primarily due to a 5.3 percentage point increase due to a favorable mix shift
among products, primarily less inkjet hardware and more laser supplies, partially offset by a
2.3 percentage point decrease due to product margins and a 0.5 percentage point decrease
attributable to restructuring-related actions, primarily from an increase in accelerated depreciation
charges YTY. Gross profit in 2008 included $42.5 million of restructuring-related charges and project
costs in connection with the Company’s restructuring activities. See “Restructuring and Related Charges
(Reversals) and Project Costs” that follows for further discussion.
36