Lexmark 2008 Annual Report Download - page 87
Download and view the complete annual report
Please find page 87 of the 2008 Lexmark annual report below. You can navigate through the pages in the report by either clicking on the pages listed below, or by using the keyword search tool below to find specific information within the annual report.-
 1
1 -
2
-
3
-
4
-
5
-
6
-
7
-
8
-
9
-
10
-
11
-
12
-
13
-
14
-
15
-
16
-
17
-
18
-
19
-
20
-
21
-
22
-
23
-
24
-
25
-
26
-
27
-
28
-
29
-
30
-
31
-
32
-
33
-
34
-
35
-
36
-
37
-
38
-
39
-
40
-
41
-
42
-
43
-
44
-
45
-
46
-
47
-
48
-
49
-
50
-
51
-
52
-
53
-
54
-
55
-
56
-
57
-
58
-
59
-
60
-
61
-
62
-
63
-
64
-
65
-
66
-
67
-
68
-
69
-
70
-
71
-
72
-
73
-
74
-
75
-
76
-
 77
77 -
 78
78 -
 79
79 -
 80
80 -
 81
81 -
 82
82 -
 83
83 -
 84
84 -
 85
85 -
 86
86 -
 87
87 -
 88
88 -
 89
89 -
 90
90 -
 91
91 -
 92
92 -
 93
93 -
 94
94 -
 95
95 -
 96
96 -
 97
97 -
98
-
99
-
100
-
101
-
102
-
103
-
104
-
105
-
106
-
107
-
108
-
109
-
110
-
111
-
112
-
113
-
114
-
115
-
116
-
117
-
118
-
119
-
120
-
121
-
122
-
123
-
124
 |
 |

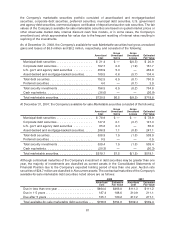
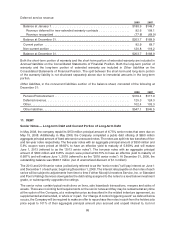
the Company’s marketable securities portfolio consisted of asset-backed and mortgage-backed
securities, corporate debt securities, preferred securities, municipal debt securities, U.S. government
and agency debt securities, commercial paper, certificates of deposit and auction rate securities. The fair
values of the Company’s available-for-sale marketable securities are based on quoted market prices or
other observable market data, internal discount cash flow models, or in some cases, the Company’s
amortized cost, which approximates fair value due to the frequent resetting of interest rates resulting in
repricing of the investments.
As of December 31, 2008, the Company’s available-for-sale Marketable securities had gross unrealized
gains and losses of $6.5 million and $8.2 million, respectively, and consisted of the following:
Amortized
Cost
Gross
Unrealized
Gains
Gross
Unrealized
Losses
Estimated
Fair Value
Municipal debt securities . . . . . . . . . . . . . . . . . . . . . $ 21.4 $ — $(0.5) $ 20.9
Corporate debt securities . . . . . . . . . . . . . . . . . . . . . 162.7 0.9 (1.9) 161.7
U.S. gov’t and agency debt securities . . . . . . . . . . . 458.9 5.0 — 463.9
Asset-backed and mortgage-backed securities. . . . . 109.5 0.6 (5.7) 104.4
Total debt securities . . . . . . . . . . . . . . . . . . . . . . . . . 752.5 6.5 (8.1) 750.9
Preferred securities . . . . . . . . . . . . . . . . . . . . . . . . . 4.0 — (0.1) 3.9
Total security investments . . . . . . . . . . . . . . . . . . . . 756.5 6.5 (8.2) 754.8
Cash equivalents . . . . . . . . . . . . . . . . . . . . . . . . . . . (36.0) — — (36.0)
Total marketable securities. . . . . . . . . . . . . . . . . . . . $720.5 $6.5 $(8.2) $718.8
At December 31, 2007, the Company’s available-for-sale Marketable securities consisted of the following:
Amortized
Cost
Gross
Unrealized
Gains
Gross
Unrealized
Losses
Estimated
Fair Value
Municipal debt securities . . . . . . . . . . . . . . . . . . . . . $ 78.9 $ — $ — $ 78.9
Corporate debt securities . . . . . . . . . . . . . . . . . . . . . 147.6 0.1 (0.7) 147.0
U.S. gov’t and agency debt securities . . . . . . . . . . . 65.6 0.3 — 65.9
Asset-backed and mortgage-backed securities. . . . . 246.8 1.1 (0.8) 247.1
Total debt securities . . . . . . . . . . . . . . . . . . . . . . . . . 538.9 1.5 (1.5) 538.9
Preferred securities . . . . . . . . . . . . . . . . . . . . . . . . . 0.5 — — 0.5
Total security investments . . . . . . . . . . . . . . . . . . . . 539.4 1.5 (1.5) 539.4
Cash equivalents . . . . . . . . . . . . . . . . . . . . . . . . . . . (20.3) — — (20.3)
Total marketable securities. . . . . . . . . . . . . . . . . . . . $519.1 $1.5 $(1.5) $519.1
Although contractual maturities of the Company’s investment in debt securities may be greater than one
year, the majority of investments are classified as current assets in the Consolidated Statements of
Financial Position due to the Company’s expected holding period of less than one year. Auction rate
securities of $24.7 million are classified in Noncurrent assets. The contractual maturities of the Company’s
available-for-sale marketable debt securities noted above are as follows:
Amortized
Cost
Estimated
Fair Value
Amortized
Cost
Estimated
Fair Value
2008 2007
Due in less than one year . . . . . . . . . . . . . . . . . . . . . $464.0 $466.0 $111.3 $111.2
Due in 1-5 years . . . . . . . . . . . . . . . . . . . . . . . . . . . . 187.4 188.6 210.9 211.1
Due after 5 years . . . . . . . . . . . . . . . . . . . . . . . . . . . 105.1 100.2 217.2 217.1
Total available-for-sale marketable debt securities . . . $756.5 $754.8 $539.4 $539.4
81