Lexmark 2008 Annual Report Download - page 52
Download and view the complete annual report
Please find page 52 of the 2008 Lexmark annual report below. You can navigate through the pages in the report by either clicking on the pages listed below, or by using the keyword search tool below to find specific information within the annual report.-
 1
1 -
2
-
3
-
4
-
5
-
6
-
7
-
8
-
9
-
10
-
11
-
12
-
13
-
14
-
15
-
16
-
17
-
18
-
19
-
20
-
21
-
22
-
23
-
24
-
25
-
26
-
27
-
28
-
29
-
30
-
31
-
32
-
33
-
34
-
35
-
36
-
37
-
38
-
39
-
40
-
41
-
 42
42 -
 43
43 -
 44
44 -
 45
45 -
 46
46 -
 47
47 -
 48
48 -
 49
49 -
 50
50 -
 51
51 -
 52
52 -
 53
53 -
 54
54 -
 55
55 -
 56
56 -
 57
57 -
 58
58 -
 59
59 -
 60
60 -
 61
61 -
 62
62 -
63
-
64
-
65
-
66
-
67
-
68
-
69
-
70
-
71
-
72
-
73
-
74
-
75
-
76
-
77
-
78
-
79
-
80
-
81
-
82
-
83
-
84
-
85
-
86
-
87
-
88
-
89
-
90
-
91
-
92
-
93
-
94
-
95
-
96
-
97
-
98
-
99
-
100
-
101
-
102
-
103
-
104
-
105
-
106
-
107
-
108
-
109
-
110
-
111
-
112
-
113
-
114
-
115
-
116
-
117
-
118
-
119
-
120
-
121
-
122
-
123
-
124
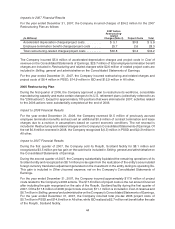
 |
 |

In 2008, there was a significant decline in the value of pension plan assets primarily resulting from a large
decline in equity markets. Because the Company defers current year differences between actual and
expected asset returns on equity investments over the subsequent five years in accordance with
prescribed accounting guidelines, this is only expected to increase the 2009 pension expense for US
plans by approximately $5 million.
The Pension Protection Act of 2006 (“the Act”) was enacted on August 17, 2006. Most of its provisions
have become effective in 2008. The Act significantly changes the funding requirements for single-
employer defined benefit pension plans. The funding requirements are now largely based on a plan’s
calculated funded status, with faster amortization of any shortfalls. The Act directs the U.S. Treasury
Department to develop a new yield curve to discount pension obligations for determining the funded status
of a plan when calculating the funding requirements. The provisions of the Act have resulted in the need for
additional funding in 2009 of approximately $76 million in the first quarter.
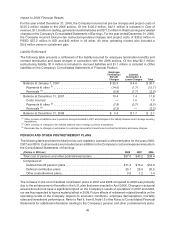
LIQUIDITY AND CAPITAL RESOURCES
Financial Position
Lexmark’s financial position remains strong at December 31, 2008, with working capital of $805 million
compared to $570 million at December 31, 2007. The increase in working capital accounts was primarily
due to the $239.8 million decrease in current liabilities driven by the Company’s repayment of
$150.0 million senior note debt that matured in the second quarter of 2008 as well as the
$79.8 million decrease in accounts payable discussed below. Current assets decreased slightly, driven
by declines in trade receivables and inventories offset by the increase in the Company’s marketable
securities investments. Although declining from 2006 to 2008, the Company continues to generate solid
cash flows from operating activities as discussed below.
The Company issued $650 million of new long-term debt in 2008, but used a large portion of the proceeds
to repurchase shares during the second half of 2008. Lexmark also had $5.5 million of other short-term
borrowings outstanding at December 31, 2008. The Company had no amounts outstanding under its
U.S. trade receivables financing program or its revolving credit facility at December 31, 2008, or
December 31, 2007. The debt to total capital ratio was 45% at December 31, 2008, compared to 10%
at December 31, 2007.
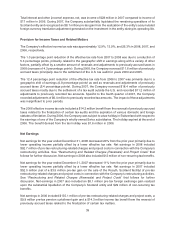
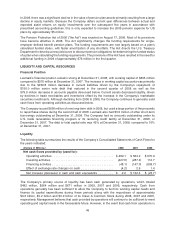
Liquidity
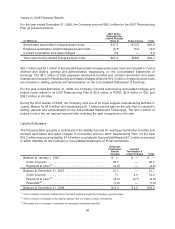
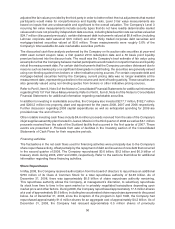
The following table summarizes the results of the Company’s Consolidated Statements of Cash Flows for
the years indicated:
(Dollars in Millions) 2008 2007 2006
Net cash flows provided by (used for):
Operating activities . . . . . . . . . . . . . . . . . . . . . . . . . . . . . . . . . . . . $ 482.1 $ 564.2 $ 670.9
Investing activities . . . . . . . . . . . . . . . . . . . . . . . . . . . . . . . . . . . . . (427.6) (287.4) 112.7
Financing activities . . . . . . . . . . . . . . . . . . . . . . . . . . . . . . . . . . . . (48.1) (147.0) (808.7)
Effect of exchange rate changes on cash . . . . . . . . . . . . . . . . . . . (4.2) 2.6 1.4
Net increase (decrease) in cash and cash equivalents . . . . . . . . . $ 2.2 $ 132.4 $ (23.7)
The Company’s primary source of liquidity has been cash generated by operations, which totaled
$482 million, $564 million and $671 million in 2008, 2007 and 2006, respectively. Cash from
operations generally has been sufficient to allow the Company to fund its working capital needs and
finance its capital expenditures during these periods along with the repurchase of approximately
$0.6 billion, $0.2 billion and $0.9 billion of its Class A Common Stock during 2008, 2007 and 2006,
respectively. Management believes that cash provided by operations will continue to be sufficient to meet
operating and capital needs in the foreseeable future. However, in the event that cash from operations is
46