Lexmark 2008 Annual Report Download - page 53
Download and view the complete annual report
Please find page 53 of the 2008 Lexmark annual report below. You can navigate through the pages in the report by either clicking on the pages listed below, or by using the keyword search tool below to find specific information within the annual report.-
 1
1 -
2
-
3
-
4
-
5
-
6
-
7
-
8
-
9
-
10
-
11
-
12
-
13
-
14
-
15
-
16
-
17
-
18
-
19
-
20
-
21
-
22
-
23
-
24
-
25
-
26
-
27
-
28
-
29
-
30
-
31
-
32
-
33
-
34
-
35
-
36
-
37
-
38
-
39
-
40
-
41
-
42
-
 43
43 -
 44
44 -
 45
45 -
 46
46 -
 47
47 -
 48
48 -
 49
49 -
 50
50 -
 51
51 -
 52
52 -
 53
53 -
 54
54 -
 55
55 -
 56
56 -
 57
57 -
 58
58 -
 59
59 -
 60
60 -
 61
61 -
 62
62 -
 63
63 -
64
-
65
-
66
-
67
-
68
-
69
-
70
-
71
-
72
-
73
-
74
-
75
-
76
-
77
-
78
-
79
-
80
-
81
-
82
-
83
-
84
-
85
-
86
-
87
-
88
-
89
-
90
-
91
-
92
-
93
-
94
-
95
-
96
-
97
-
98
-
99
-
100
-
101
-
102
-
103
-
104
-
105
-
106
-
107
-
108
-
109
-
110
-
111
-
112
-
113
-
114
-
115
-
116
-
117
-
118
-
119
-
120
-
121
-
122
-
123
-
124
 |
 |
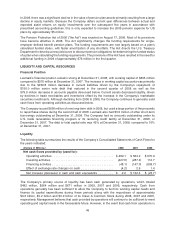
not sufficient, the Company has other potential sources of cash through utilization of its accounts
receivable financing program, revolving credit facility or other financing sources.
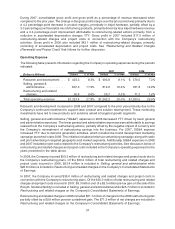
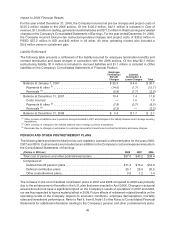
Operating activities
The decrease in cash flows from operating activities from 2007 to 2008 was driven by the $116.7 million
unfavorable YTY change in Accounts Payable, the $110.2 million combined unfavorable changes in
Accrued liabilities and Other assets and liabilities, as well as various other lines impacted by the general
decline in profitability in the third and fourth quarter of 2008. These movements were offset partially by the
$145.0 million favorable YTY impact of Trade receivables.
The unfavorable impact of Accounts Payable was largely due to the timing of vendor payments. In 2007,
the Company was able to lengthen the cycle in which it pays its vendors, as indicated by the cash
conversion days chart in the following section. In addition, a cash flow timing benefit was realized at
year-end 2007 related to vendors with end of month payment terms who were paid the first week of 2008.
These two conditions resulted in a larger year-end 2007 Accounts Payable balance, which was then paid in
2008 resulting in unfavorable YTY movement.
The unfavorable impacts of Accrued liabilities and Other assets and liabilities were due to many factors.
Notable YTY fluctuations in cash outflows included $21.7 million of additional cash paid for income taxes,
$97.8 million paid in 2008 compared to $76.1 million in 2007, as well as $14.3 million of additional cash paid
for interest, $26.9 million paid in 2008 compared to $12.6 million paid in 2007. Due to the current level of
senior note debt outstanding, interest payments should be roughly $30 million higher per year than
payments made in recent years, though a small portion of this increase may be capitalizable for certain
long lived assets under construction.
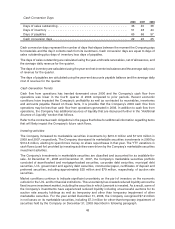
The favorable impact of Accounts Receivable was driven by collections, as indicated in the cash
conversion days table in the section below. Days of sales outstanding decreased 4 days from
year-end 2007 to year-end 2008 due to improvements in delinquency, geographic shift in sales to
faster collecting countries, and the timing within the quarter in which the sales occurred. In regard to
the weakening economy, the Company has not experienced any notable customer liquidity issues
impacting the collectibility of its receivables, with the exception of the Circuit City bankruptcy which did
not have a material impact on the Company’s current year cash flows or results of operations.
The decrease in cash flows from operating activities from 2006 to 2007 primarily resulted from lower net
earnings as well as unfavorable changes of $69 million in Accrued liabilities and $61 million in Trade
Receivables.
The change in Accrued liabilities was primarily due to unfavorable changes in accrued salaries and
incentive compensation of $49 million and restructuring-related accruals of $27 million compared to the
prior year. The impact of accrued salaries and incentive compensation was driven by the payment of 2006
bonuses in the first quarter of 2007. Bonuses earned in 2006 were considerably higher than those earned
in 2005. Payments for such programs generally occur in the first quarter of the subsequent year. The
impact of restructuring-related accruals was driven by the relatively small movement in the liability in 2007
compared to that of 2006, resulting in a lower non-cash addition to net earnings when deriving cash flows
from operations. In 2007, there were approximately $26 million of accruals offset by $23 million of
payments and other adjustments, resulting in a non-cash addition to net earnings of only $3 million related
to the Company’s restructuring actions. In 2006, there were approximately $81 million of accruals offset
partially by $51 million of payments and other adjustments, resulting in a non-cash addition to net earnings
of $30 million related to the Company’s restructuring actions.
The $61 million change noted in Trade Receivables was primarily the result of greater collections in the
year 2006 versus 2007, the majority of which occurred in the first quarter. A significantly higher trade
receivables balance existed at December 31, 2005 versus December 31, 2006 due to a larger portion of
the fourth quarter sales for 2005 occurring in the later part of the quarter.
47