Lexmark 2008 Annual Report Download - page 110
Download and view the complete annual report
Please find page 110 of the 2008 Lexmark annual report below. You can navigate through the pages in the report by either clicking on the pages listed below, or by using the keyword search tool below to find specific information within the annual report.-
 1
1 -
2
-
3
-
4
-
5
-
6
-
7
-
8
-
9
-
10
-
11
-
12
-
13
-
14
-
15
-
16
-
17
-
18
-
19
-
20
-
21
-
22
-
23
-
24
-
25
-
26
-
27
-
28
-
29
-
30
-
31
-
32
-
33
-
34
-
35
-
36
-
37
-
38
-
39
-
40
-
41
-
42
-
43
-
44
-
45
-
46
-
47
-
48
-
49
-
50
-
51
-
52
-
53
-
54
-
55
-
56
-
57
-
58
-
59
-
60
-
61
-
62
-
63
-
64
-
65
-
66
-
67
-
68
-
69
-
70
-
71
-
72
-
73
-
74
-
75
-
76
-
77
-
78
-
79
-
80
-
81
-
82
-
83
-
84
-
85
-
86
-
87
-
88
-
89
-
90
-
91
-
92
-
93
-
94
-
95
-
96
-
97
-
98
-
99
-
 100
100 -
 101
101 -
 102
102 -
 103
103 -
 104
104 -
 105
105 -
 106
106 -
 107
107 -
 108
108 -
 109
109 -
 110
110 -
 111
111 -
 112
112 -
 113
113 -
 114
114 -
 115
115 -
 116
116 -
 117
117 -
 118
118 -
 119
119 -
 120
120 -
121
-
122
-
123
-
124
 |
 |

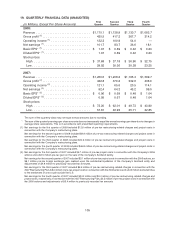
In connection with the Company’s restructuring plans, operating income (loss) noted above for the year
ended December 31, 2008, includes restructuring-related charges of $23.0 million in ISD, $19.8 million in
PSSD and $19.3 million in All other.
In connection with the 2007 Restructuring Plan, operating income (loss) noted above for the year ended
December 31, 2007, included employee termination benefit charges of $13.9 million in ISD, $6.5 million in
PSSD and $10.4 million in All other.
In connection with the 2006 restructuring, operating income (loss) noted above for the year ended
December 31, 2006, included restructuring-related charges of $54.7 million in ISD, $35.2 million in PSSD
and $31.2 million in All other. All other operating income also included a $9.9 million pension plan freeze
benefit.
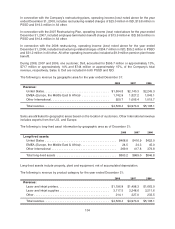
During 2008, 2007 and 2006, one customer, Dell, accounted for $595.7 million or approximately 13%,
$717 million or approximately 14% and $744 million or approximately 15%, of the Company’s total
revenue, respectively. Sales to Dell are included in both PSSD and ISD.
The following is revenue by geographic area for the year ended December 31:
2008 2007 2006
Revenue:
United States . . . . . . . . . . . . . . . . . . . . . . . . . . . . . . . . . . . . . . $1,864.8 $2,140.3 $2,245.3
EMEA (Europe, the Middle East & Africa) . . . . . . . . . . . . . . . . 1,742.9 1,827.2 1,843.1
Other International . . . . . . . . . . . . . . . . . . . . . . . . . . . . . . . . . . 920.7 1,006.4 1,019.7
Total revenue . . . . . . . . . . . . . . . . . . . . . . . . . . . . . . . . . . . . . . $4,528.4 $4,973.9 $5,108.1
Sales are attributed to geographic areas based on the location of customers. Other International revenue
includes exports from the U.S. and Europe.
The following is long-lived asset information by geographic area as of December 31:
2008 2007 2006
Long-lived assets:
United States . . . . . . . . . . . . . . . . . . . . . . . . . . . . . . . . . . . . . . . . . . $468.8 $416.9 $422.0
EMEA (Europe, the Middle East & Africa) . . . . . . . . . . . . . . . . . . . . . 24.5 34.3 45.0
Other International . . . . . . . . . . . . . . . . . . . . . . . . . . . . . . . . . . . . . . 369.9 417.8 379.8
Total long-lived assets . . . . . . . . . . . . . . . . . . . . . . . . . . . . . . . . . . . $863.2 $869.0 $846.8
Long-lived assets include property, plant and equipment, net of accumulated depreciation.
The following is revenue by product category for the year ended December 31:
2008 2007 2006
Revenue:
Laser and inkjet printers. . . . . . . . . . . . . . . . . . . . . . . . . . . . . . $1,196.8 $1,498.3 $1,663.0
Laser and inkjet supplies . . . . . . . . . . . . . . . . . . . . . . . . . . . . . 3,117.5 3,248.6 3,211.6
Other . . . . . . . . . . . . . . . . . . . . . . . . . . . . . . . . . . . . . . . . . . . . 214.1 227.0 233.5
Total revenue . . . . . . . . . . . . . . . . . . . . . . . . . . . . . . . . . . . . . . $4,528.4 $4,973.9 $5,108.1
104