Lexmark 2008 Annual Report Download - page 29
Download and view the complete annual report
Please find page 29 of the 2008 Lexmark annual report below. You can navigate through the pages in the report by either clicking on the pages listed below, or by using the keyword search tool below to find specific information within the annual report.-
 1
1 -
2
-
3
-
4
-
5
-
6
-
7
-
8
-
9
-
10
-
11
-
12
-
13
-
14
-
15
-
16
-
17
-
18
-
 19
19 -
 20
20 -
 21
21 -
 22
22 -
 23
23 -
 24
24 -
 25
25 -
 26
26 -
 27
27 -
 28
28 -
 29
29 -
 30
30 -
 31
31 -
 32
32 -
 33
33 -
 34
34 -
 35
35 -
 36
36 -
 37
37 -
 38
38 -
 39
39 -
40
-
41
-
42
-
43
-
44
-
45
-
46
-
47
-
48
-
49
-
50
-
51
-
52
-
53
-
54
-
55
-
56
-
57
-
58
-
59
-
60
-
61
-
62
-
63
-
64
-
65
-
66
-
67
-
68
-
69
-
70
-
71
-
72
-
73
-
74
-
75
-
76
-
77
-
78
-
79
-
80
-
81
-
82
-
83
-
84
-
85
-
86
-
87
-
88
-
89
-
90
-
91
-
92
-
93
-
94
-
95
-
96
-
97
-
98
-
99
-
100
-
101
-
102
-
103
-
104
-
105
-
106
-
107
-
108
-
109
-
110
-
111
-
112
-
113
-
114
-
115
-
116
-
117
-
118
-
119
-
120
-
121
-
122
-
123
-
124
 |
 |

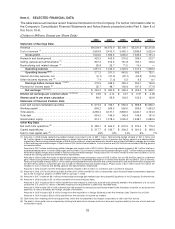
Item 6. SELECTED FINANCIAL DATA
The table below summarizes recent financial information for the Company. For further information refer to
the Company’s Consolidated Financial Statements and Notes thereto presented under Part II, Item 8 of
this Form 10-K.
(Dollars in Millions, Except per Share Data)
2008 2007 2006 2005 2004
Statement of Earnings Data:
Revenue ..................................... $4,528.4 $4,973.9 $5,108.1 $5,221.5 $5,313.8
Cost of revenue
(1)
.............................. 2,993.8 3,410.3 3,462.1 3,585.9 3,522.4
Gross profit ............................... 1,534.6 1,563.6 1,646.0 1,635.6 1,791.4
Research and development ........................ 423.3 403.8 370.5 336.4 312.7
Selling, general and administrative
(1)
................. 807.3 812.8 761.8 755.1 746.6
Restructuring and related charges
(1)
................. 26.8 25.7 71.2 10.4 —
Operating expense.......................... 1,257.4 1,242.3 1,203.5 1,101.9 1,059.3
Operating income
(1)(2)
....................... 277.2 321.3 442.5 533.7 732.1
Interest (income) expense, net...................... (6.1) (21.2) (22.1) (26.5) (14.5)
Other (income) expense, net
(3)
..................... 7.4 (7.0) 5.3 6.5 0.1
Earnings before income taxes
(1)(2)(3)
............ 275.9 349.5 459.3 553.7 746.5
Provision for income taxes
(4)
...................... 35.7 48.7 120.9 197.4 177.8
Net earnings
(1)(2)(3)(4)
........................ $ 240.2 $ 300.8 $ 338.4 $ 356.3 $ 568.7
Diluted net earnings per common share
(1)(2)(3)(4)
....... $ 2.69 $ 3.14 $ 3.27 $ 2.91 $ 4.28
Shares used in per share calculation ............... 89.2 95.8 103.5 122.3 132.9
Statement of Financial Position Data:
Cash and current marketable securities ............... $ 973.3 $ 796.1 $ 550.9 $ 888.8 $1,566.7
Working capital ................................ 805.2 569.5 506.0 935.9 1,533.2
Total assets ................................... 3,265.4 3,121.1 2,849.0 3,330.1 4,124.3
Total debt .................................... 654.2 149.9 149.8 149.6 151.0
Stockholders’ equity . . . .......................... 812.1 1,278.3 1,035.2 1,428.7 2,082.9
Other Key Data:
Net cash from operations
(5)
....................... $ 482.1 $ 564.2 $ 670.9 $ 576.4 $ 775.4
Capital expenditures. . . .......................... $ 217.7 $ 182.7 $ 200.2 $ 201.3 $ 198.3
Debt to total capital ratio
(6)
........................ 45% 10% 13% 9% 7%
(1) Amounts in 2008 include restructuring-related charges and project costs of $92.7 million. Restructuring-related charges of $27.2 million and
$8.1 million related to accelerated depreciation on certain fixed assets are included in Cost of revenue and Selling, general and administrative,
respectively. Restructuring-related charges of $26.8 million relating to employee termination benefits and contract termination charges are included
in Restructuring and related charges. Project costs of $15.3 million are included in Cost of revenue, and $15.3 million are included in Selling, general
and administrative.
Amounts in 2007 include restructuring-related charges and project costs of $52.0 million. Restructuring-related charges of $5.1 million relating to
accelerated depreciation on certain fixed assets are included in Cost of revenue. Restructuring-related charges of $25.7 million relating to employee
termination benefit charges are included in Restructuring and related charges. Project costs of $11.9 million and $9.3 million are included in Cost of
revenue and Selling, general and administrative, respectively.
Amounts in 2006 include the impact of restructuring-related charges and project costs of $125.2 million (net of a $9.9 million pension curtailment
gain). Restructuring-related charges of $40.0 million relating to accelerated depreciation on certain fixed assets are included in Cost of revenue.
Restructuring-related charges of $81.1 million relating to employee termination benefits and contract termination and lease termination charges and
the $9.9 million pension curtailment gain are included in Restructuring and related charges. Project costs of $2.1 million and $11.9 million are
included in Cost of revenue and Selling, general and administrative, respectively.
Amounts in 2005 include one-time termination benefit charges of $10.4 million in connection with a workforce reduction.
(2) Amounts in 2008, 2007 and 2006 include $32.8 million, $41.3 million and $43.2 million, respectively, of pre-tax stock-based compensation expense
due to the Company’s adoption of SFAS 123R on January 1, 2006.
(3) Amounts in 2007 include an $8.1 million pre-tax foreign exchange gain realized upon the substantial liquidation of the Company’s Scotland entity.
(4) Amounts in 2008 include an $11.6 million benefit from nonrecurring tax items.
Amounts in 2007 include an $18.4 million benefit from the reversal of previously accrued taxes primarily related to the settlement of a tax audit
outside the U.S. and $11.2 million of benefits resulting from adjustments to previously recorded taxes.
Amounts in 2006 include a $14.3 million benefit from the reversal of previously accrued taxes related to the finalization of certain tax audits and the
expiration of various domestic and foreign statutes of limitations.
Amounts in 2005 include a $51.9 million charge from the repatriation of foreign dividends under the American Jobs Creation Act of 2004.
Amounts in 2004 include a $20.0 million benefit from the resolution of income tax matters.
(5) Cash flows from investing and financing activities, which are not presented, are integral components of total cash flow activity.
(6) The debt to total capital ratio is computed by dividing total debt (which includes both short-term and long-term debt) by the sum of total debt and
stockholders’ equity.
23