Lexmark 2008 Annual Report Download - page 44
Download and view the complete annual report
Please find page 44 of the 2008 Lexmark annual report below. You can navigate through the pages in the report by either clicking on the pages listed below, or by using the keyword search tool below to find specific information within the annual report.-
 1
1 -
2
-
3
-
4
-
5
-
6
-
7
-
8
-
9
-
10
-
11
-
12
-
13
-
14
-
15
-
16
-
17
-
18
-
19
-
20
-
21
-
22
-
23
-
24
-
25
-
26
-
27
-
28
-
29
-
30
-
31
-
32
-
33
-
 34
34 -
 35
35 -
 36
36 -
 37
37 -
 38
38 -
 39
39 -
 40
40 -
 41
41 -
 42
42 -
 43
43 -
 44
44 -
 45
45 -
 46
46 -
 47
47 -
 48
48 -
 49
49 -
 50
50 -
 51
51 -
 52
52 -
 53
53 -
 54
54 -
55
-
56
-
57
-
58
-
59
-
60
-
61
-
62
-
63
-
64
-
65
-
66
-
67
-
68
-
69
-
70
-
71
-
72
-
73
-
74
-
75
-
76
-
77
-
78
-
79
-
80
-
81
-
82
-
83
-
84
-
85
-
86
-
87
-
88
-
89
-
90
-
91
-
92
-
93
-
94
-
95
-
96
-
97
-
98
-
99
-
100
-
101
-
102
-
103
-
104
-
105
-
106
-
107
-
108
-
109
-
110
-
111
-
112
-
113
-
114
-
115
-
116
-
117
-
118
-
119
-
120
-
121
-
122
-
123
-
124
 |
 |

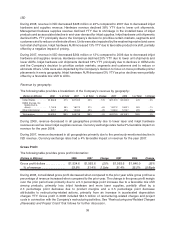
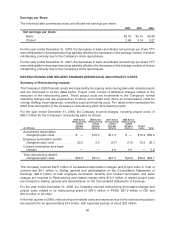
See “Restructuring and Related Charges (Reversals) and Project Costs” that follows for further discussion
of the Company’s restructuring plans.
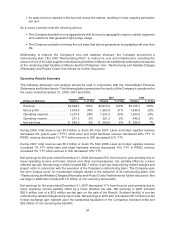
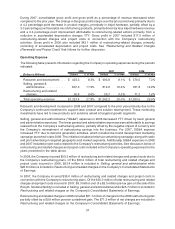
Operating Income (Loss)
The following table provides operating income by market segment:
(Dollars in Millions) 2008 2007 Change 2007 2006 Change
PSSD . . . . . . . . . . . . . . . . . . . . . . $ 497.1 $ 612.0 (19)% $ 612.0 $ 600.1 2%
% of revenue ............... 16.7% 20.4% (3.7)pts 20.4% 20.9% (0.5)pts
ISD . . . . . . . . . . . . . . . . . . . . . . . . $ 137.1 93.4 47% $ 93.4 246.0 (62)%
% of revenue ............... 8.9% 4.7% 4.2pts 4.7% 11.0% (6.3)pts
All other . . . . . . . . . . . . . . . . . . . . . $(357.0) (384.1) 7% $(384.1) (403.6) 5%
Total operating income (loss) . . . . . $ 277.2 $ 321.3 (14)% $ 321.3 $ 442.5 (27)%
% of total revenue ........... 6.1% 6.5% (0.4)pts 6.5% 8.7% (2.2)pts
For the year ended December 31, 2008, the decrease in consolidated operating income was due to
decreased gross profits and higher operating expenses. Operating income for PSSD decreased YTY due
to higher operating expenses, reflecting higher product development investments, and lower hardware
gross profits, reflecting the impact of aggressive pricing as well as a negative impact due to product mix.
Operating income for ISD increased YTY due to increased hardware gross margin, due to lower hardware
unit sales, and decreased operating expenses, partially offset by lower supplies revenue.
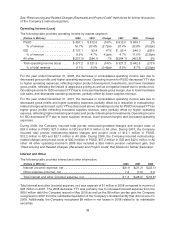
For the year ended December 31, 2007, the decrease in consolidated operating income was due to
decreased gross profits and higher operating expenses partially offset by a reduction in restructuring-
related charges and project costs YTYas discussed above. Operating income for PSSD increased YTYas
higher gross profits, reflecting increased supplies revenue, were partially offset by higher operating
expense, reflecting higher marketing and sales and product development investments. Operating income
for ISD decreased YTY due to lower supplies revenue, lower product margins and increased operating
expenses.
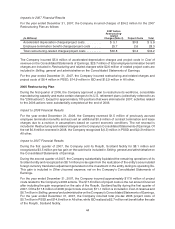
During 2008, the Company incurred total pre-tax restructuring-related charges and project costs of
$24.4 million in PSSD, $27.3 million in ISD and $41.0 million in All other. During 2007, the Company
incurred total pre-tax restructuring-related charges and project costs of $12.1 million in PSSD,
$12.2 million in ISD and $27.7 million in All other. During 2006, the Company incurred restructuring-
related charges and project costs of $35.9 million in PSSD, $57.2 million in ISD and $42.0 million in All
other. All other operating income in 2006 also included a $9.9 million pension curtailment gain. See
“Restructuring and Related Charges (Reversals) and Project Costs” that follows for further discussion.
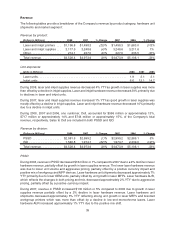
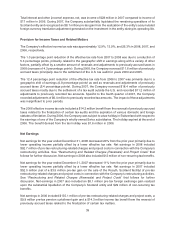
Interest and Other
The following table provides interest and other information:
(Dollars in Millions) 2008 2007 2006
Interest (income) expense, net . . . . . . . . . . . . . . . . . . . . . . . . . . . . . . . . . $(6.1) $(21.2) $(22.1)
Other expense (income), net . . . . . . . . . . . . . . . . . . . . . . . . . . . . . . . . . . 7.4 (7.0) 5.3
Total interest and other (income) expense, net . . . . . . . . . . . . . . . . . . . . . $ 1.3 $(28.2) $(16.8)
Total interest and other (income) expense, net, was expense of $1 million in 2008 compared to income of
$28 million in 2007. The 2008 decrease YTY was primarily due to increased interest expense from the
$650 million debt the Company issued in May 2008 as well as the $8 million pre-tax gain the Company
recognized in 2007 from the substantial liquidation of the Company’s Scotland entity that did not occur in
2008. Additionally, the Company recognized $8 million in net losses in 2008 related to its marketable
securities.
38