LensCrafters 2007 Annual Report Download - page 72
Download and view the complete annual report
Please find page 72 of the 2007 LensCrafters annual report below. You can navigate through the pages in the report by either clicking on the pages listed below, or by using the keyword search tool below to find specific information within the annual report.
| 71 <
Luxottica Group prepared the consolidated financial statements contained in this report in
accordance with generally accepted U.S. accounting principles known as U.S. GAAP. Luxottica
Group, through the approval of CONSOB (Report no. 27021 of April 7, 2000), decided that
preparing its financial and economic statements in accordance with U.S. GAAP, rather than the
corresponding International Accounting Standards / International Financial Reporting Standards,
IAS / IFRS, was opportune for the following reasons:
• It maintains continuity and consistency with the financial information reported in previous years,
which were prepared under U.S. GAAP, facilitating their comparison;
• It maintains continuity and consistency in the Group’s consolidated financial statements and
those of its U.S. subsidiaries (prepared under U.S. GAAP), which account for over 50% of the
Group’s results.
Luxottica Group makes available the consolidated financial statements prepared in accordance
with International Accounting Standards / International Financial Reporting Standards (IAS/IFRS), in
compliance with EEC regulations (EEC Regulation no. 1606/2002). Beginning with the financial
statements for fiscal year 2005, European companies listed on the Stock Exchange must prepare
their consolidated financial statements in accordance with IAS/IFRS. In the following table, the
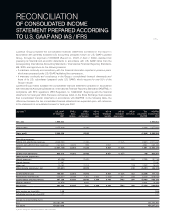
differences between the two consolidated financial statements are expanded upon, with reference
to the statements of consolidated income for fiscal year 2007.
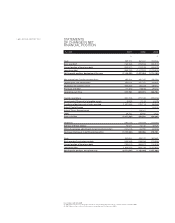
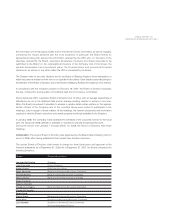
RECONCILIATION
OF CONSOLIDATED INCOME
STATEMENT PREPARED ACCORDING
TO U.S. GAAP AND IAS / IFRS
(Euro/000) (1)
U,S, GAAP IFRS 2 IFRS 3 IAS 12 IAS 19 IAS 38 IAS 39 Total IAS/IFRS
31 December Stock Business Income Employee Intangibile Derivatives adjustments 31 December
2007 Options combination taxes benefits depreciation IAS/IFRS 2007
Net sales 4,966,054 4,966,054
Cost of sales (1,575,618) (2,046) (2,046) (1,577,664)
Gross profit 3,390,436 (2,046) (2,046) 3,388,390
Operating expenses:
Selling and advertising expenses (2,069,280) (1,230) (1,157) (2,387) (2,071,667)
General and administrative expenses (487,843) (4,381) (192) 8,957 4,384 (483,459)
Total (2,557,123) (4,381) (1,422) 8,957 (1,157) 1,997 (2,555,126)
Income from operations 833,313 (4,381) (3,468) 8,957 (1,157) (48) 833,264
Other income (expenses):
Interest expenses (89,498) (2,849) 609 (2,239) (91,738)
Interest income 17,087 17,087
Other, net 19,780 (1,074) (178) (1,252) 18,529
Other income (expenses), net (52,631) (3,923) 432 (3,491) (56,123)
Income before taxes 780,681 (4,381) (7,391) 8,957 (1,157) 432 (3,539) 777,142
Provision for income taxes (273,501) (2,258) 1,354 2,300 (2,465) 451 (226) (5,442) (278,943)
income before minority interests 507,180 (6,638) (6,036) 2,300 6,493 (706) 206 (8,982) 498,199
Minority interests (14,976) 6,628 6,628 (8,349)
Net income 492,204 (6,638) 591 2,300 6,493 (706) 206 (2,354) 489,850
Basic earnings per share/ADS 1.08 1.08
Fully diluted earnings per share/ADS 1.07 1.07
Average no. of outstanding shares:
Base 455,184,797 455,184,797
Fully diluted 458,530,609 458,297,325
(1) Except earnings per share (ADS), which are expressed in Euro.


