LensCrafters 2007 Annual Report Download - page 123
Download and view the complete annual report
Please find page 123 of the 2007 LensCrafters annual report below. You can navigate through the pages in the report by either clicking on the pages listed below, or by using the keyword search tool below to find specific information within the annual report.-
 1
1 -
2
-
3
-
4
-
5
-
6
-
7
-
8
-
9
-
10
-
11
-
12
-
13
-
14
-
15
-
16
-
17
-
18
-
19
-
20
-
21
-
22
-
23
-
24
-
25
-
26
-
27
-
28
-
29
-
30
-
31
-
32
-
33
-
34
-
35
-
36
-
37
-
38
-
39
-
40
-
41
-
42
-
43
-
44
-
45
-
46
-
47
-
48
-
49
-
50
-
51
-
52
-
53
-
54
-
55
-
56
-
57
-
58
-
59
-
60
-
61
-
62
-
63
-
64
-
65
-
66
-
67
-
68
-
69
-
70
-
71
-
72
-
73
-
74
-
75
-
76
-
77
-
78
-
79
-
80
-
81
-
82
-
83
-
84
-
85
-
86
-
87
-
88
-
89
-
90
-
91
-
92
-
93
-
94
-
95
-
96
-
97
-
98
-
99
-
100
-
101
-
102
-
103
-
104
-
105
-
106
-
107
-
108
-
109
-
110
-
111
-
112
-
 113
113 -
 114
114 -
 115
115 -
 116
116 -
 117
117 -
 118
118 -
 119
119 -
 120
120 -
 121
121 -
 122
122 -
 123
123 -
 124
124 -
 125
125 -
 126
126 -
 127
127 -
 128
128 -
 129
129 -
 130
130 -
 131
131 -
 132
132 -
 133
133 -
134
-
135
-
136
-
137
-
138
-
139
-
140
-
141
-
142
-
143
-
144
-
145
-
146
-
147
-
148
-
149
-
150
-
151
-
152
-
153
-
154
-
155
-
156
-
157
-
158
-
159
-
160
-
161
-
162
-
163
-
164
-
165
-
166
-
167
-
168
-
169
-
170
-
171
-
172
-
173
-
174
-
175
-
176
-
177
-
178
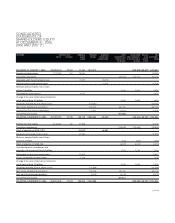
 |
 |

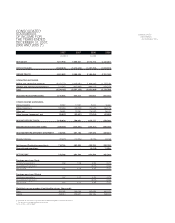
2007 2007 2006 2005
(US$/000) (1) (Euro/000)
CASH FLOWS FROM OPERATING ACTIVITIES
Net income (Continuing operations) 718,766 492,204 430,705 330,790
ADJUSTMENTS TO RECONCILE NET INCOME
TO NET CASH PROVIDED BY OPERATING ACTIVITIES
Minority interest in income of consolidated subsidiaries 21,870 14,976 8,715 9,253
Non cash stock-based compensation 61,510 42,121 47,969 21,706
Excess tax benefits from stock-based compensation (9,218) (6,313) (7,279)
Depreciation and amortization 339,977 232,813 220,797 184,652
Benefit for deferred income taxes (65,768) (45,037) (72,509) (91,297)
Loss/(Gain) on disposals of fixed assets, net (28,238) (19,337) 4,930 6,559
Termination indemnities matured during the year, net (5,249) (3,595) 4,369 3,723
CHANGES IN OPERATING ASSETS AND LIABILITIES,
NET OF ACQUISITION OF BUSINESSES
Accounts receivable (81,349) (55,707) (83,107) (33,634)
Prepaid expenses and other (322,327) (220,727) 8,568 (56,767)
Inventories (61,209) (41,916) (27,658) 66,491
Accounts payable 65,695 44,988 76,021 49,615
Accrued expenses and other (13,776) (9,433) (25,243) (17,544)
Accrual for customers’ right of return 14,391 9,855 11,121 5,448
Income taxes payable (134,556) (92,142) 5,875 126,708
Total adjustments (218,247) (149,454) 172,569 274,914
CASH PROVIDED BY OPERATING ACTIVITIES
FROM CONTINUING OPERATIONS
500,519 342,750 603,274 605,704
CASH FLOWS FROM INVESTING ACTIVITIES
Property, plant and equipment:
• Additions (488,863) (334,769) (272,180) (220,016)
• Disposals 43,371 29,700 21,563 1,022
Increase in investments (5,872)
Purchases of businesses net of cash acquired (2,177,433) (1,491,086) (134,114) (86,966)
Sale of investment in Pearl Europe 144,000
Sale of Things Remembered 128,007
Additions of intangible assets (5,671) (3,883) (1,140) (4,479)
CASH USED IN INVESTING ACTIVITIES OF CONTINUING OPERATIONS (2,628,596) (1,800,038) (263,737) (166,439)
(cont’d)
CONSOLIDATED
STATEMENTS
OF CASH FLOWS
FOR THE YEARS ENDED
DECEMBER 31, 2007,
2006 AND 2005 (*)