LensCrafters 2007 Annual Report Download - page 111
Download and view the complete annual report
Please find page 111 of the 2007 LensCrafters annual report below. You can navigate through the pages in the report by either clicking on the pages listed below, or by using the keyword search tool below to find specific information within the annual report.-
 1
1 -
2
-
3
-
4
-
5
-
6
-
7
-
8
-
9
-
10
-
11
-
12
-
13
-
14
-
15
-
16
-
17
-
18
-
19
-
20
-
21
-
22
-
23
-
24
-
25
-
26
-
27
-
28
-
29
-
30
-
31
-
32
-
33
-
34
-
35
-
36
-
37
-
38
-
39
-
40
-
41
-
42
-
43
-
44
-
45
-
46
-
47
-
48
-
49
-
50
-
51
-
52
-
53
-
54
-
55
-
56
-
57
-
58
-
59
-
60
-
61
-
62
-
63
-
64
-
65
-
66
-
67
-
68
-
69
-
70
-
71
-
72
-
73
-
74
-
75
-
76
-
77
-
78
-
79
-
80
-
81
-
82
-
83
-
84
-
85
-
86
-
87
-
88
-
89
-
90
-
91
-
92
-
93
-
94
-
95
-
96
-
97
-
98
-
99
-
100
-
 101
101 -
 102
102 -
 103
103 -
 104
104 -
 105
105 -
 106
106 -
 107
107 -
 108
108 -
 109
109 -
 110
110 -
 111
111 -
 112
112 -
 113
113 -
 114
114 -
 115
115 -
 116
116 -
 117
117 -
 118
118 -
 119
119 -
 120
120 -
 121
121 -
122
-
123
-
124
-
125
-
126
-
127
-
128
-
129
-
130
-
131
-
132
-
133
-
134
-
135
-
136
-
137
-
138
-
139
-
140
-
141
-
142
-
143
-
144
-
145
-
146
-
147
-
148
-
149
-
150
-
151
-
152
-
153
-
154
-
155
-
156
-
157
-
158
-
159
-
160
-
161
-
162
-
163
-
164
-
165
-
166
-
167
-
168
-
169
-
170
-
171
-
172
-
173
-
174
-
175
-
176
-
177
-
178
 |
 |
> 110 | ANNUAL REPORT 2007
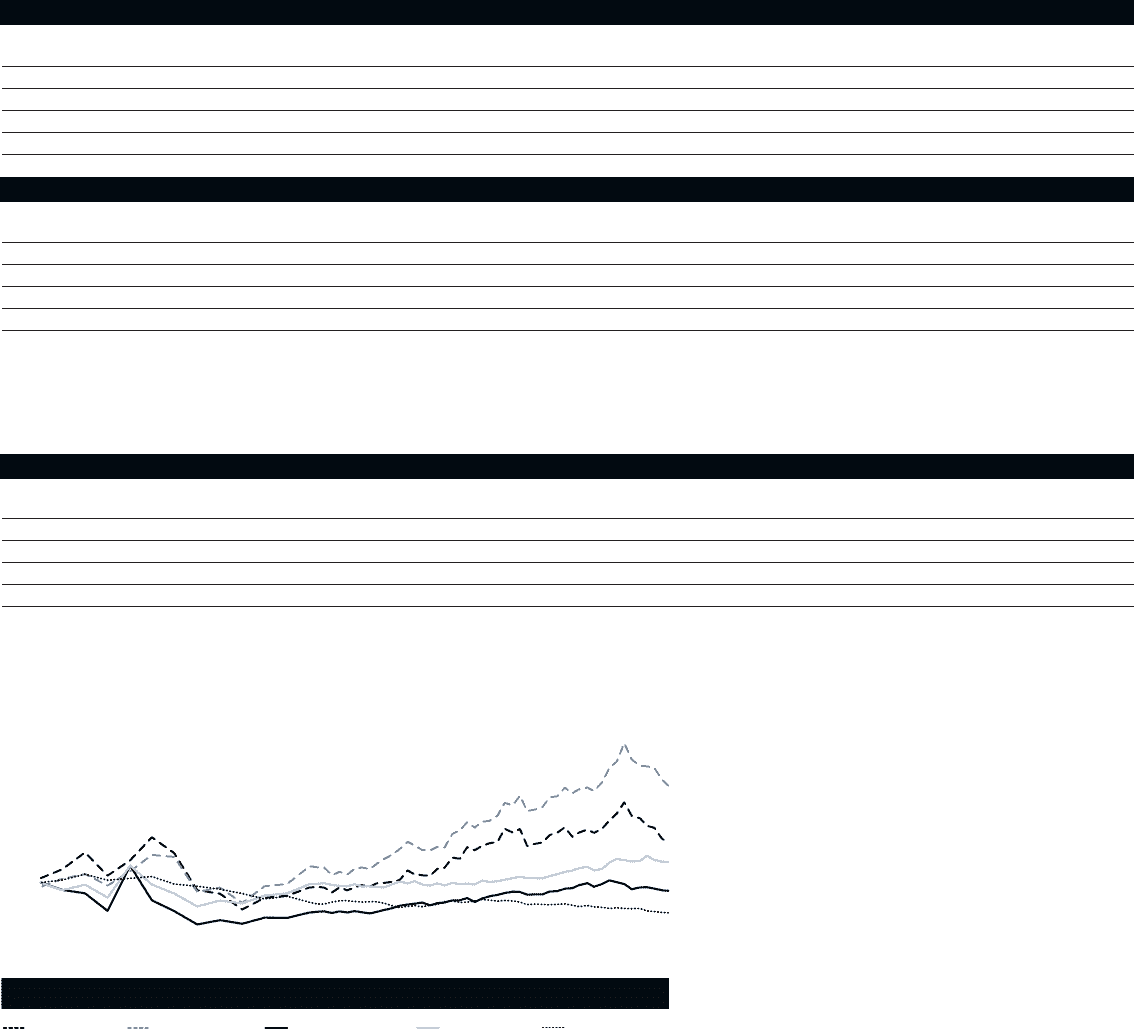
MTA Ordinary share (By quarter - In Euro)
2001 2002 2003 2004 2005 2006
Low High Close Low High Close Low High Close Low High Close Low High Close Low High Close
First 7.20 14.37 16.80 18.34 22.95 22.43 9.25 13.48 9.81 12.42 14.08 12.80 15.11 17.02 15.83 20.37 24.12 22.74
Second 15.04 19.11 19.11 18.54 22.88 19.69 9.85 12.37 11.92 12.82 13.99 13.70 15.31 17.55 17.13 19.30 24.19 21.22
Third 13.41 20.62 15.74 11.75 19.05 13.22 11.67 13.96 12.23 13.31 14.54 14.42 17.21 21.00 20.69 20.15 23.25 23.23
Fourth 14.88 19.59 18.43 12.00 15.52 12.58 12.35 14.82 13.70 14.31 15.51 14.99 19.62 21.94 21.43 22.53 24.46 23.28
Year 13.41 20.62 11.75 22.95 9.25 14.82 12.42 15.51 15.11 21.94 19.30 24.46
5
10
15
20
25
30
35
40
45
Jan-01
may-01
sep-01
Jan-02
may-02
sep-02
Jan-03
may-03
sep-03
Jan-04
may-04
sep-04
Jan-05
may-05
sep-05
Jan-06
may-06
sep-06
Jan-07
may-07
sep-07
MTA (in Euro) NYSE (in US$) S&P Mib (rebased) DJIA (rebased) Euro/US$ (rebased)
ADS AND ORDINARY SHARE PERFORMANCE ON THE NYSE
AND MTA AND MAIN INDEXES
LISTINGS: 18 YEARS ON THE NYSE AND SEVEN YEARS ON THE MTA
NYSE ADS (By quarter - In US$ (1))
1990 1991 1992 1993 1994
Low High Close Low High Close Low High Close Low High Close Low High Close
First 0.95 1.06 0.98 0.99 1.41 1.38 2.74 3.23 2.90 2.49 2.49 2.49 2.79 3.38 3.04
Second 0.96 1.38 1.32 1.39 1.71 1.51 2.63 3.28 2.71 2.56 2.56 2.56 2.98 3.50 3.41
Third 0.99 1.46 1.01 1.51 2.28 2.26 2.66 3.11 2.95 2.38 2.38 2.38 3.28 3.58 3.39
Fourth 0.79 1.11 1.02 2.25 2.75 2.75 2.25 2.93 2.51 2.95 2.95 2.95 3.23 3.65 3.41
Year 0.79 1.46 0.99 2.75 2.25 3.28 2.95 2.95 2.79 3.65
2000 2001 2002 2003 2004
Low High Close Low High Close Low High Close Low High Close Low High Close
First 7.97 12.34 12.25 13.13 16.09 15.17 15.90 19.82 19.38 10.23 14.05 10.95 15.18 17.85 15.82
Second 11.19 12.97 12.19 13.25 16.00 16.00 17.85 20.85 19.00 10.69 14.11 13.90 15.18 16.90 16.90
Third 12.38 17.00 16.13 12.15 17.99 13.99 11.82 18.70 12.88 13.73 15.48 14.29 16.30 17.85 17.85
Fourth 13.00 16.44 13.75 13.45 17.21 16.48 12.00 15.51 13.65 14.40 18.15 17.40 17.99 20.39 20.39
Year 7.97 17.00 12.15 17.99 11.82 20.85 10.23 18.15 15.18 20.39