LensCrafters 2007 Annual Report Download - page 65
Download and view the complete annual report
Please find page 65 of the 2007 LensCrafters annual report below. You can navigate through the pages in the report by either clicking on the pages listed below, or by using the keyword search tool below to find specific information within the annual report.-
 1
1 -
2
-
3
-
4
-
5
-
6
-
7
-
8
-
9
-
10
-
11
-
12
-
13
-
14
-
15
-
16
-
17
-
18
-
19
-
20
-
21
-
22
-
23
-
24
-
25
-
26
-
27
-
28
-
29
-
30
-
31
-
32
-
33
-
34
-
35
-
36
-
37
-
38
-
39
-
40
-
41
-
42
-
43
-
44
-
45
-
46
-
47
-
48
-
49
-
50
-
51
-
52
-
53
-
54
-
 55
55 -
 56
56 -
 57
57 -
 58
58 -
 59
59 -
 60
60 -
 61
61 -
 62
62 -
 63
63 -
 64
64 -
 65
65 -
 66
66 -
 67
67 -
 68
68 -
 69
69 -
 70
70 -
 71
71 -
 72
72 -
 73
73 -
 74
74 -
 75
75 -
76
-
77
-
78
-
79
-
80
-
81
-
82
-
83
-
84
-
85
-
86
-
87
-
88
-
89
-
90
-
91
-
92
-
93
-
94
-
95
-
96
-
97
-
98
-
99
-
100
-
101
-
102
-
103
-
104
-
105
-
106
-
107
-
108
-
109
-
110
-
111
-
112
-
113
-
114
-
115
-
116
-
117
-
118
-
119
-
120
-
121
-
122
-
123
-
124
-
125
-
126
-
127
-
128
-
129
-
130
-
131
-
132
-
133
-
134
-
135
-
136
-
137
-
138
-
139
-
140
-
141
-
142
-
143
-
144
-
145
-
146
-
147
-
148
-
149
-
150
-
151
-
152
-
153
-
154
-
155
-
156
-
157
-
158
-
159
-
160
-
161
-
162
-
163
-
164
-
165
-
166
-
167
-
168
-
169
-
170
-
171
-
172
-
173
-
174
-
175
-
176
-
177
-
178
 |
 |
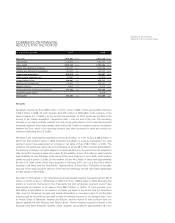
> 64 | ANNUAL REPORT 2007
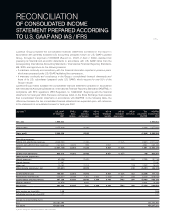
78.5% of our net sales to third parties in our manufacturing and wholesale segment in 2007 and
2006, respectively.
During 2007, net sales in the retail segment accounted for approximately 65.7% of total net sales, as
compared to approximately 70.4% of net sales in 2006. This decrease in retail net sales as a
percentage of total net sales is primarily attributable to a significant increase in net sales to third
parties in our manufacturing and wholesale segment, which grew by 23.3% in 2007, and to negative
currency effects, which primarily affected net sales in the retail segment, which are primarily
concentrated in North America, Australia and China, where the Euro is not the functional currency.
On a geographic basis, which includes Oakley from the date of acquisition, combined retail and
manufacturing and wholesale operations in the United States and Canada comprised 61.5%, or
Euro 3,053.6 million, of total net sales in 2007, which decreased as compared to net sales in the
United States and Canada of Euro 3,076.4 million in 2006, mainly due to the negative impact of the
strengthening of the Euro compared to the U.S. Dollar. Net sales for operations in Asia-Pacific
comprised 11.8% of total net sales and totaled Euro 584.2 million in net sales during 2007, as
compared to Euro 498.4 million in 2006, which represented a 17.2% increase in net sales, mainly
due to the newly acquired stores in China. Net sales for the rest of the world comprised 26.7% of
total net sales and accounted for Euro 1,328.3 million of net sales during 2007, which represented
an increase in net sales of Euro 226.9 million or 20.6% as compared to 2006. The increase in net
sales for the rest of the world was primarily attributable to strong performance in almost all major
European markets.
During 2007, net sales to third parties in our manufacturing and wholesale segment in Europe
comprised 59.9% of our total net sales in this segment and experienced an increase of 20.2%
from Euro 849.8 million in 2006 to Euro 1,021.1 million in 2007. Net sales to third parties in our
manufacturing and wholesale segment in the United States and Canada comprised 18.1% of our
total net sales in this segment in 2007 and experienced an increase in its local currency of 44.6%
from US$ 295.5 million in 2006 to US$ 427.2 million in 2007. In Euro, net sales in the United
States and Canada increased by 31.3% as the local currency increase was reduced by the
strengthening of the Euro compared to the U.S. Dollar. Net sales to third parties in our
manufacturing and wholesale segment in the rest of the world comprised 21.9% of our total net
sales in this segment and experienced an increase of 25.9% from Euro 296.8 million in 2006 to
Euro 373.5 million in 2007.
During 2007, net sales in the retail segment in the United States and Canada comprised 84.1% of
our total net sales in this segment. In Euro, net sales in the United States and Canada decreased
by 3.4% as the local currency increase was offset by the strengthening of the Euro compared to
the U.S. Dollar. In U.S. Dollars, retail net sales in the United States and Canada experienced an
increase of 5.5% from US$ 3,566.4 million in 2006 to US$ 3,763.7 million in 2007. Net sales in the
retail segment in the rest of the world comprised 15.9% of our total net sales in this segment and
experienced an increase of 14.3% from Euro 453.2 million in 2006 to Euro 517.9 million in 2007.
Cost of sales
Cost of sales increased by Euro 87.9 million, or 5.9%, to Euro 1,575.6 million in 2007, from Euro
1,487.7 million in 2006, primarily attributable to our overall sales growth and the inclusion of
Oakley’s cost of sales for the period from the acquisition date of Euro 37.6 million. As a
percentage of net sales, cost of sales decreased to 31.7% in 2007, as compared to 31.8% in 2006.
In 2007, excluding the frames manufactured at our acquired Oakley facilities, the average number
of frames produced daily in our facilities increased to approximately 175,800, as compared to