LensCrafters 2007 Annual Report Download - page 164
Download and view the complete annual report
Please find page 164 of the 2007 LensCrafters annual report below. You can navigate through the pages in the report by either clicking on the pages listed below, or by using the keyword search tool below to find specific information within the annual report.-
 1
1 -
2
-
3
-
4
-
5
-
6
-
7
-
8
-
9
-
10
-
11
-
12
-
13
-
14
-
15
-
16
-
17
-
18
-
19
-
20
-
21
-
22
-
23
-
24
-
25
-
26
-
27
-
28
-
29
-
30
-
31
-
32
-
33
-
34
-
35
-
36
-
37
-
38
-
39
-
40
-
41
-
42
-
43
-
44
-
45
-
46
-
47
-
48
-
49
-
50
-
51
-
52
-
53
-
54
-
55
-
56
-
57
-
58
-
59
-
60
-
61
-
62
-
63
-
64
-
65
-
66
-
67
-
68
-
69
-
70
-
71
-
72
-
73
-
74
-
75
-
76
-
77
-
78
-
79
-
80
-
81
-
82
-
83
-
84
-
85
-
86
-
87
-
88
-
89
-
90
-
91
-
92
-
93
-
94
-
95
-
96
-
97
-
98
-
99
-
100
-
101
-
102
-
103
-
104
-
105
-
106
-
107
-
108
-
109
-
110
-
111
-
112
-
113
-
114
-
115
-
116
-
117
-
118
-
119
-
120
-
121
-
122
-
123
-
124
-
125
-
126
-
127
-
128
-
129
-
130
-
131
-
132
-
133
-
134
-
135
-
136
-
137
-
138
-
139
-
140
-
141
-
142
-
143
-
144
-
145
-
146
-
147
-
148
-
149
-
150
-
151
-
152
-
153
-
 154
154 -
 155
155 -
 156
156 -
 157
157 -
 158
158 -
 159
159 -
 160
160 -
 161
161 -
 162
162 -
 163
163 -
 164
164 -
 165
165 -
 166
166 -
 167
167 -
 168
168 -
 169
169 -
 170
170 -
 171
171 -
 172
172 -
 173
173 -
 174
174 -
175
-
176
-
177
-
178
 |
 |

NOTES TO CONSOLIDATED
FINANCIAL STATEMENTS |163 <
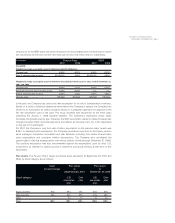
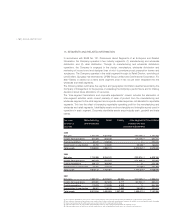
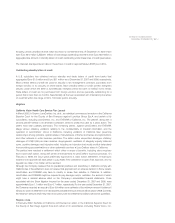
The geographic segments include Italy, the main manufacturing and distribution base, United
States and Canada (which includes the United States of America, Canada and Caribbean islands),
Asia Pacific (which includes Australia, New Zealand, China, Hong Kong, Japan) and Other (which
includes all other geographic locations including Europe (excluding Italy), South and Central
America and the Middle East). Sales are attributed to geographic segments based on the legal
entity domicile where the sale is originated. Intercompany sales included in inter-segment
elimination are accounted for on a cost plus mark-up basis.
(5) No single customer represents five percent or more of sales in any year presented.
(6) Sales, income from operations and identifiable assets are the result of combination of legal entities located in the same geographic area.
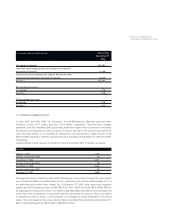
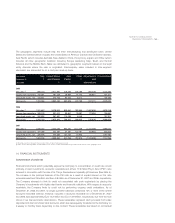
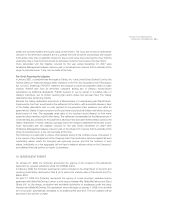
14. FINANCIAL INSTRUMENTS
Concentration of credit risk
Financial instruments which potentially expose the Company to concentration of credit risk consist
primarily of cash investments, accounts receivable and a Euro 17.9 million Pay In Kind (“PIK”) note
received in connection with the sale of its Things Remembered specialty gift business (See Note 4).
The increase in the principal balance of the PIK note as a result of unpaid interest on this note
receivable was Euro 2.8 million and Euro 0.8 million as of December 31, 2007 and 2006, respectively.
The Company attempts to limit its credit risk associated with cash equivalents by placing the
Company’s investments with highly rated banks and financial institutions. With respect to accounts
receivable, the Company limits its credit risk by performing ongoing credit evaluations. As of
December 31, 2006 and 2007, no single customer balances comprised 10% or more of the overall
accounts receivable balance. However, included in accounts receivable as of December 31, 2007
and 2006, was approximately Euro 12.3 million and Euro 13.9 million, respectively, due from the host
stores of our license brands retail division. These receivables represent cash proceeds from sales
deposited into the host stores bank accounts, which are subsequently forwarded to the Company on
a weekly or monthly basis depending on the contract. These receivables are based on contractual
Year ended Italy United States Asia Other Adjustments Consolidated
December 31 (6) and Canada -Pacific (6) and
(Euro/000) (6) (6) eliminations
2005
Net sales (5) 998,420 2,811,860 516,793 575,196 (768,006) 4,134,263
Income from operations 258,391 291,438 46,993 51,200 (66,621) 581,401
Long lived assets, net 228,841 375,776 92,335 8,214 - 705,166
Total assets 1,294,955 2,932,483 662,926 270,169 (187,011) 4,973,522
2006
Net sales (5) 1,321,887 3,076,503 603,640 761,955 (1,087,828) 4,676,156
Income from operations 389,275 331,002 33,841 79,397 (77,528) 755,987
Long lived assets, net 280,692 387,861 110,099 8,549 - 787,201
Total assets 1,331,719 2,675,833 748,305 388,825 (175,804) 4,968,878
2007
Net sales (5) 1,506,077 3,073,086 685,561 1,114,429 (1,413,099) 4,966,054
Income from operations 377,799 324,167 57,191 127,761 (53,605) 833,313
Long lived assets, net 326,978 575,566 134,435 20,803 - 1,057,782
Total assets 1,894,546 4,839,680 804,786 752,818 (1,134,565) 7,157,266