LensCrafters 2007 Annual Report Download - page 121
Download and view the complete annual report
Please find page 121 of the 2007 LensCrafters annual report below. You can navigate through the pages in the report by either clicking on the pages listed below, or by using the keyword search tool below to find specific information within the annual report.-
 1
1 -
2
-
3
-
4
-
5
-
6
-
7
-
8
-
9
-
10
-
11
-
12
-
13
-
14
-
15
-
16
-
17
-
18
-
19
-
20
-
21
-
22
-
23
-
24
-
25
-
26
-
27
-
28
-
29
-
30
-
31
-
32
-
33
-
34
-
35
-
36
-
37
-
38
-
39
-
40
-
41
-
42
-
43
-
44
-
45
-
46
-
47
-
48
-
49
-
50
-
51
-
52
-
53
-
54
-
55
-
56
-
57
-
58
-
59
-
60
-
61
-
62
-
63
-
64
-
65
-
66
-
67
-
68
-
69
-
70
-
71
-
72
-
73
-
74
-
75
-
76
-
77
-
78
-
79
-
80
-
81
-
82
-
83
-
84
-
85
-
86
-
87
-
88
-
89
-
90
-
91
-
92
-
93
-
94
-
95
-
96
-
97
-
98
-
99
-
100
-
101
-
102
-
103
-
104
-
105
-
106
-
107
-
108
-
109
-
110
-
 111
111 -
 112
112 -
 113
113 -
 114
114 -
 115
115 -
 116
116 -
 117
117 -
 118
118 -
 119
119 -
 120
120 -
 121
121 -
 122
122 -
 123
123 -
 124
124 -
 125
125 -
 126
126 -
 127
127 -
 128
128 -
 129
129 -
 130
130 -
 131
131 -
132
-
133
-
134
-
135
-
136
-
137
-
138
-
139
-
140
-
141
-
142
-
143
-
144
-
145
-
146
-
147
-
148
-
149
-
150
-
151
-
152
-
153
-
154
-
155
-
156
-
157
-
158
-
159
-
160
-
161
-
162
-
163
-
164
-
165
-
166
-
167
-
168
-
169
-
170
-
171
-
172
-
173
-
174
-
175
-
176
-
177
-
178
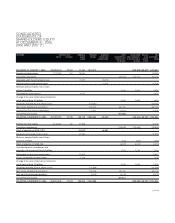
 |
 |

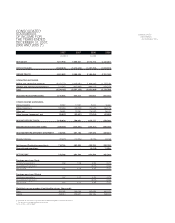
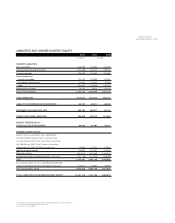
CONSOLIDATED
STATEMENTS OF
SHAREHOLDERS’ EQUITY
AT DECEMBER 31, 2005,
2006 AND 2007 (*)
(Euro/000) Common stock Additional Retained Unearned Other Accumulated Treasury Total
Shares Ammount paid-in earnings stock-based comprehensive other comprehen- share shareholders’
capital compensation income (loss) sive income (loss) amount equity
net of taxes net of tax at cost
BALANCES AT JANUARY 1, 2005 455,205,473 27,312 47,167 1,812,073 (320,958) (69,987) 1,495,607
Exercise of stock options 2,770,250 167 28,062 28,229
Translation adjustment 157,776 157,776 157,776
Aggregate stock based compensation 70,273 (70,273)
Realized stock based compensation 21,706 21,706
Minimum pension liability, net of taxes
of Euro 1.6 million 2,534 2,534 2,534
Tax benefit on stock options 4,677 4,677
Change in fair value of derivative instruments,
net of taxes of Euro 2.3 million 4,694 4,694 4,694
Dividends declared (Euro 0.23 per share) (103,484) (103,484)
Net income (Continuing operations) 330,790 330,790 330,790
Income from Discontinued operations 11,504 11,504 11,504
Comprehensive income 507,298
BALANCES, DECEMBER 31, 2005 457,975,723 27,479 150,179 2,050,883 (48,567) (155,954) (69,987) 1,954,033
Exercise of stock options 2,240,525 134 24,308 24,443
Translation adjustmente (126,853) (126,853) (126,853)
Effect of adoption of SFAS 123 R (48,567) 48,567 -
Realized stock based compensation 47,969 47,969
Minimum pension liability, net of taxes
of Euro 0,4 million (624) (624) (624)
Effect of adoption of SFAS 158 (8,409) (8,409) (8,409)
Unrealized gain on available-for-sale
securities, net of taxes of Euro 0.5 million 1,244 1,244 1,244
Diluted gain on business combinations 21,847 21,847
Excess tax benefit on stock options 7,279 7,279
Change in fair value of derivative instruments,
net of taxes of Euro 1.8 million 2,003 2,003 2,003
Dividends declared (Euro 0.29 per share) (131,369) (131,369)
Net income (Continuing operations) 430,705 430,705 430,705
Loss from Discontinued operations (6,419) (6,419) (6,419)
Comprehensive income 291,647
BALANCES, DECEMBER 31, 2006 460,216,248 27,613 203,016 2,343,800 (288,593) (69,987) 2,215,849
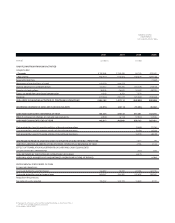
(cont’d)