LensCrafters 2007 Annual Report Download - page 15
Download and view the complete annual report
Please find page 15 of the 2007 LensCrafters annual report below. You can navigate through the pages in the report by either clicking on the pages listed below, or by using the keyword search tool below to find specific information within the annual report.-
 1
1 -
2
-
3
-
4
-
 5
5 -
 6
6 -
 7
7 -
 8
8 -
 9
9 -
 10
10 -
 11
11 -
 12
12 -
 13
13 -
 14
14 -
 15
15 -
 16
16 -
 17
17 -
 18
18 -
 19
19 -
 20
20 -
 21
21 -
 22
22 -
 23
23 -
 24
24 -
 25
25 -
26
-
27
-
28
-
29
-
30
-
31
-
32
-
33
-
34
-
35
-
36
-
37
-
38
-
39
-
40
-
41
-
42
-
43
-
44
-
45
-
46
-
47
-
48
-
49
-
50
-
51
-
52
-
53
-
54
-
55
-
56
-
57
-
58
-
59
-
60
-
61
-
62
-
63
-
64
-
65
-
66
-
67
-
68
-
69
-
70
-
71
-
72
-
73
-
74
-
75
-
76
-
77
-
78
-
79
-
80
-
81
-
82
-
83
-
84
-
85
-
86
-
87
-
88
-
89
-
90
-
91
-
92
-
93
-
94
-
95
-
96
-
97
-
98
-
99
-
100
-
101
-
102
-
103
-
104
-
105
-
106
-
107
-
108
-
109
-
110
-
111
-
112
-
113
-
114
-
115
-
116
-
117
-
118
-
119
-
120
-
121
-
122
-
123
-
124
-
125
-
126
-
127
-
128
-
129
-
130
-
131
-
132
-
133
-
134
-
135
-
136
-
137
-
138
-
139
-
140
-
141
-
142
-
143
-
144
-
145
-
146
-
147
-
148
-
149
-
150
-
151
-
152
-
153
-
154
-
155
-
156
-
157
-
158
-
159
-
160
-
161
-
162
-
163
-
164
-
165
-
166
-
167
-
168
-
169
-
170
-
171
-
172
-
173
-
174
-
175
-
176
-
177
-
178
 |
 |

In accordance to U.S GAAP
(1) 1 ADS = 1 ordinary share. (2) Proposed by the Board of Directors and to be submitted for approval at the Annual Shareholders’ Meeting on May 13, 2008. (3) Figures include results of OPSM Group operations from the acquisition date
(August 1, 2003). (4) Figures include results of Cole National operations from the acquisition date (October 4, 2004). (5) Results of Things Remembered, Inc., a former subsidiary that was sold in September 2006, are reclassified as
discontinued operations and are not included in results from continuing operations for 2006, 2005 and 2004. (6) Figures include results of Oakley operations from the acquisition date (November 14, 2007). (*) In Euro and US$.
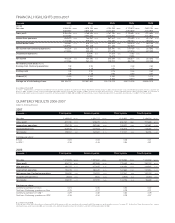
FINANCIAL HIGHLIGHTS 2003-2007
2007
(Euro/000) (1) (3) First quarter Second quarter Third quarter Fourth quarter
Net sales 1,299,825 100,0% 1,326,777 100.0% 1,150,952 100.0% 1,188,500 100.0%
Gross profit 874,026 67,2% 918,620 69.2% 806,101 70.0% 791,689 66.6%
Income from operations 224,125 17,2% 262,486 19.8% 195,021 16.9% 151,681 12.8%
Income before taxes 208,918 16,1% 247,953 18.7% 180,315 15.7% 143,496 12.1%
Net income 128,257 9,9% 154,581 11.7% 112,441 9.8% 96,926 8.2%
Earnings per share:
In Euro 0.28 0.34 0.25 0.21
In US$ (2) 0.35 0.45 0.34 0.31
QUARTERLY RESULTS 2006-2007
(Subject to limited audit review)
2006
In accordance to U.S GAAP
(1) Except for per share (ADS) data, which is in Euro and US$. (2) All amounts in US$ were translated at the average Euro/US$ exchange rate for the period in reference. See page 111. (3) Results of Things Remembered, Inc., a former
subsidiary that was sold in September 2006, are reclassified as discontinued operations and are not included in results from continuing operations for 2006.
(Euro 000) 2007 2006 2005 2004 2003
(US$ 000) (6) (5) (5) (4) (3)
Net sales 4,966,054 100.0% 4,676,156 100.0% 4,134,263 100.0% 3,179,613 100.0% 2,852,194 100.0%
6,805,977 5,870,208 5,144,602 3,953,849 3,224,976
Gross profit 3,390,436 68.3% 3,188,456 68.2% 2,761,190 66.8% 2,126,537 66.9% 1,913,834 67.1%
4,646,592 4,002,625 3,435,975 2,644,349 2,163,972
Income from operations 833,313 16.8% 755,987 16.2% 581,401 14.1% 479,499 15.1% 431,787 15.1%
1,142,055 949,027 723,484 596,257 488,222
Income before taxes 780,681 15.7% 678,177 14.5% 539,309 13.0% 444,575 14.0% 389,793 13.7%
1,069,924 851,348 671,106 552,829 440,739
Net income from continuing operations 492,204 9.9% 430,705 9.2% 330,790 8.0% 279,109 8.8% 267,343 9.4%
674,566 540,685 411,629 347,073 302,285
Discontinued operations --(6,419) 0.1% 11,504 0.3% 7,765 0.2% --
- (8,058) 14,315 9,655 --
Net income 492,204 9.9% 424,286 9.1% 342,294 8.3% 286,874 9.0% 267,343 9.4%
674,566 532,626 425,945 356,728 302,285
Per ordinary share/(ADS) (1) (*)
Earnings from Continuing operations 1.08 0.95 0.73 0.62 0.60
1.48 1.19 0.91 0.77 0.67
Earnings total 1.08 0.94 0.76 0.64 0.60
1.48 1.18 0.95 0.80 0.67
Dividend (2) 0.490 0.420 0.290 0.230 0.210
n.a. 0.564 0.365 0.277 0.256
Average no, of outstanding shares 455,184,797 452,897,854 450,179,073 448,275,028 448,664,413
(Euro/000) (1) (3) First quarter Second quarter Third quarter Fourth quarter
Net sales 1.217.923 100.0% 1,227,300 100.0% 1,120,380 100.0% 1,110,553 100.0%
Gross profit 815,212 66.9% 837,585 68.2% 775,469 69.2% 760,190 68.5%
Utile operativo 196,737 16.2% 207,845 16.9% 186,480 16.6% 164,925 14.9%
Income from operations 176,048 14.5% 186,649 15.2% 167,665 15.0% 147,816 13.3%
Net income from Continuing operations 106,630 8.8% 116,291 9.5% 107,041 9.6% 100,743 9.1%
Discontinued operations (3,381) 0.3% 4,931 0.4% (2,915) 0.3% (5,054) 0.5%
Net income 103,249 8.5% 121,222 9.9% 104,126 9.3% 95,689 8.6%
Earnings per share:
Continuing operations in Euro 0.24 0.26 0.24 0.22
Total from Continuing operations in Euro 0.23 0.27 0.23 0.21
Continuing operations in US$ (2) 0.29 0.32 0.30 0.29
Total from Continuing operations in US$ (2) 0.28 0.34 0.29 0.27