LensCrafters 2007 Annual Report Download - page 118
Download and view the complete annual report
Please find page 118 of the 2007 LensCrafters annual report below. You can navigate through the pages in the report by either clicking on the pages listed below, or by using the keyword search tool below to find specific information within the annual report.-
 1
1 -
2
-
3
-
4
-
5
-
6
-
7
-
8
-
9
-
10
-
11
-
12
-
13
-
14
-
15
-
16
-
17
-
18
-
19
-
20
-
21
-
22
-
23
-
24
-
25
-
26
-
27
-
28
-
29
-
30
-
31
-
32
-
33
-
34
-
35
-
36
-
37
-
38
-
39
-
40
-
41
-
42
-
43
-
44
-
45
-
46
-
47
-
48
-
49
-
50
-
51
-
52
-
53
-
54
-
55
-
56
-
57
-
58
-
59
-
60
-
61
-
62
-
63
-
64
-
65
-
66
-
67
-
68
-
69
-
70
-
71
-
72
-
73
-
74
-
75
-
76
-
77
-
78
-
79
-
80
-
81
-
82
-
83
-
84
-
85
-
86
-
87
-
88
-
89
-
90
-
91
-
92
-
93
-
94
-
95
-
96
-
97
-
98
-
99
-
100
-
101
-
102
-
103
-
104
-
105
-
106
-
107
-
 108
108 -
 109
109 -
 110
110 -
 111
111 -
 112
112 -
 113
113 -
 114
114 -
 115
115 -
 116
116 -
 117
117 -
 118
118 -
 119
119 -
 120
120 -
 121
121 -
 122
122 -
 123
123 -
 124
124 -
 125
125 -
 126
126 -
 127
127 -
 128
128 -
129
-
130
-
131
-
132
-
133
-
134
-
135
-
136
-
137
-
138
-
139
-
140
-
141
-
142
-
143
-
144
-
145
-
146
-
147
-
148
-
149
-
150
-
151
-
152
-
153
-
154
-
155
-
156
-
157
-
158
-
159
-
160
-
161
-
162
-
163
-
164
-
165
-
166
-
167
-
168
-
169
-
170
-
171
-
172
-
173
-
174
-
175
-
176
-
177
-
178
 |
 |

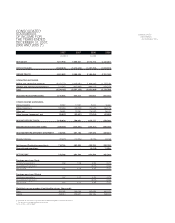
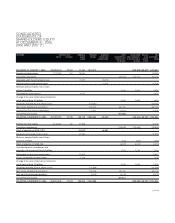
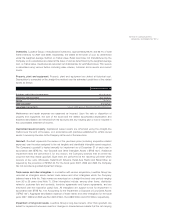
2007 2007 2006 2005
(US$/000) (1) (Euro/000)
NET SALES 7,251,929 4,966,054 4,676,156 4,134,263
COST OF SALES (2,300,876) (1,575,618) (1,487,700) (1,373,073)
GROSS PROFIT 4,951,053 3,390,436 3,188,456 2,761,190
OPERATING EXPENSES
Selling and advertising expenses (3,021,770) (2,069,280) (1,948,466) (1,755,536)
General and administrative expenses (712,397) (487,843) (484,002) (424,253)
Total (3,734,167) (2,557,123) (2,432,468) (2,179,789)
INCOME FROM OPERATIONS 1,216,886 833,313 755,987 581,401
OTHER INCOME (EXPENSES)
Interest income 24,952 17,087 9,804 5,650
Interest expenses (130,694) (89,498) (70,622) (66,171)
Other, net 28,885 19,780 (16,992) 18,429
Other income (expenses), net (76,857) (52,631) (77,810) (42,092)
INCOME BEFORE TAXES 1,140,029 780,681 678,177 539,309
PROVISION FOR INCOME TAXES (399,393) (273,501) (238,757) (199,266)
INCOME BEFORE MINORITY INTERESTS 740,636 507,180 439,420 340,043
Minority interests (21,870) (14,976) (8,715) (9,253)
Net income (Continuing operations) 718,766 492,204 430,705 330,790
Discontinued operations --(6,419) 11,504
NET INCOME 718,766 492,204 424,286 342,294
Earnings per share: Basic
Continuing operations 1.58 1.08 0.95 0.73
Discontinued operations (0.01) 0.03
Net income 1.58 1.08 0.94 0.76
Earnings per share: Diluted
Continuing operations 1.57 1.07 0.94 0.73
Discontinued operations (0.01) 0.03
Net income 1.57 1.07 0.93 0.76
Weighted average number of outstanding shares (thousands)
Basic 455,185 455,185 452,898 450,179
Diluted 458,531 458,531 456,186 453,303
CONSOLIDATED
STATEMENTS
OF INCOME FOR
THE YEARS ENDED
DECEMBER 31, 2007,
2006 AND 2005 (*)
(1) Translated for convenience at the New York City Noon Buying Rate as determined in Note 1.
See notes to the consolidated financial statements.
(*) In accordance with US GAAP.
CONSOLIDATED
STATEMENTS
OF INCOME | 117 <