LensCrafters 2007 Annual Report Download - page 119
Download and view the complete annual report
Please find page 119 of the 2007 LensCrafters annual report below. You can navigate through the pages in the report by either clicking on the pages listed below, or by using the keyword search tool below to find specific information within the annual report.-
 1
1 -
2
-
3
-
4
-
5
-
6
-
7
-
8
-
9
-
10
-
11
-
12
-
13
-
14
-
15
-
16
-
17
-
18
-
19
-
20
-
21
-
22
-
23
-
24
-
25
-
26
-
27
-
28
-
29
-
30
-
31
-
32
-
33
-
34
-
35
-
36
-
37
-
38
-
39
-
40
-
41
-
42
-
43
-
44
-
45
-
46
-
47
-
48
-
49
-
50
-
51
-
52
-
53
-
54
-
55
-
56
-
57
-
58
-
59
-
60
-
61
-
62
-
63
-
64
-
65
-
66
-
67
-
68
-
69
-
70
-
71
-
72
-
73
-
74
-
75
-
76
-
77
-
78
-
79
-
80
-
81
-
82
-
83
-
84
-
85
-
86
-
87
-
88
-
89
-
90
-
91
-
92
-
93
-
94
-
95
-
96
-
97
-
98
-
99
-
100
-
101
-
102
-
103
-
104
-
105
-
106
-
107
-
108
-
 109
109 -
 110
110 -
 111
111 -
 112
112 -
 113
113 -
 114
114 -
 115
115 -
 116
116 -
 117
117 -
 118
118 -
 119
119 -
 120
120 -
 121
121 -
 122
122 -
 123
123 -
 124
124 -
 125
125 -
 126
126 -
 127
127 -
 128
128 -
 129
129 -
130
-
131
-
132
-
133
-
134
-
135
-
136
-
137
-
138
-
139
-
140
-
141
-
142
-
143
-
144
-
145
-
146
-
147
-
148
-
149
-
150
-
151
-
152
-
153
-
154
-
155
-
156
-
157
-
158
-
159
-
160
-
161
-
162
-
163
-
164
-
165
-
166
-
167
-
168
-
169
-
170
-
171
-
172
-
173
-
174
-
175
-
176
-
177
-
178
 |
 |

> 118 | ANNUAL REPORT 2007
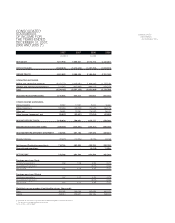
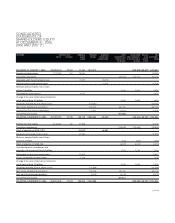
ASSETS
2007 2007 2006
(US$/000) (1) (Euro/000)
CURRENT ASSETS
Cash and cash equivalents 442,317 302,894 339,122
Marketable securities 31,170 21,345 -
Accounts receivable - net (Less allowance
for doubtful accounts: Euro 25.5 million
(US$ 37.3 million) in 2007 and Euro 22.7 million in 2006) 971,368 665,184 533,772
Sales and income taxes receivable 129,967 89,000 24,924
Inventories, net 839,696 575,016 400,895
Prepaid expenses and other 203,426 139,305 98,156
Deferred tax assets, net 172,101 117,853 96,595
Total current assets 2,790,045 1,910,597 1,493,464
PROPERTY, PLANT AND EQUIPMENT, net 1,544,679 1,057,782 787,201
OTHER ASSETS
Goodwill 3,799,467 2,601,840 1,694,614
Intangible assets, net 1,907,323 1,306,117 830,362
Investments 25,801 17,668 23,531
Other assets 285,298 195,370 94,501
Deferred tax assets 99,142 67,891 45,205
Total other assets 6,117,031 4,188,887 2,688,213
TOTAL ASSETS 10,451,755 7,157,266 4,968,878
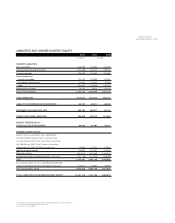
CONSOLIDATED
BALANCE SHEETS AT
DECEMBER 31, 2007
AND 2006 (*)
(1) Translated for convenience at the New York City Noon Buying Rate as determined in Note 1.
See notes to the consolidated financial statements.
(*) In accordance with US GAAP.