LensCrafters 2004 Annual Report Download - page 97
Download and view the complete annual report
Please find page 97 of the 2004 LensCrafters annual report below. You can navigate through the pages in the report by either clicking on the pages listed below, or by using the keyword search tool below to find specific information within the annual report.-
 1
1 -
2
-
3
-
4
-
5
-
6
-
7
-
8
-
9
-
10
-
11
-
12
-
13
-
14
-
15
-
16
-
17
-
18
-
19
-
20
-
21
-
22
-
23
-
24
-
25
-
26
-
27
-
28
-
29
-
30
-
31
-
32
-
33
-
34
-
35
-
36
-
37
-
38
-
39
-
40
-
41
-
42
-
43
-
44
-
45
-
46
-
47
-
48
-
49
-
50
-
51
-
52
-
53
-
54
-
55
-
56
-
57
-
58
-
59
-
60
-
61
-
62
-
63
-
64
-
65
-
66
-
67
-
68
-
69
-
70
-
71
-
72
-
73
-
74
-
75
-
76
-
77
-
78
-
79
-
80
-
81
-
82
-
83
-
84
-
85
-
86
-
 87
87 -
 88
88 -
 89
89 -
 90
90 -
 91
91 -
 92
92 -
 93
93 -
 94
94 -
 95
95 -
 96
96 -
 97
97 -
 98
98 -
 99
99 -
 100
100 -
 101
101 -
 102
102 -
 103
103 -
 104
104 -
 105
105 -
 106
106 -
 107
107 -
108
-
109
-
110
-
111
-
112
-
113
-
114
-
115
-
116
-
117
-
118
-
119
-
120
-
121
-
122
-
123
-
124
-
125
-
126
-
127
-
128
-
129
-
130
-
131
-
132
-
133
-
134
-
135
-
136
-
137
-
138
-
139
-
140
-
141
-
142
-
143
-
144
-
145
-
146
-
147
-
148
-
149
-
150
-
151
-
152
-
153
 |
 |

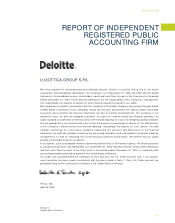
INDEPENDENT AUDITORS’ REPORT
96
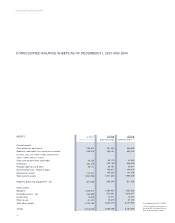
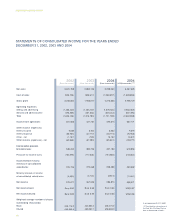
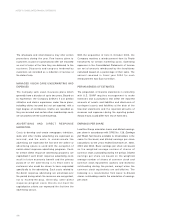
STATEMENTS OF CONSOLIDATED INCOME FOR THE YEARS ENDED
DECEMBER 31, 2002, 2003 AND 2004
In accordance with U.S. GAAP
(1) Translated for convenience at
the New York City Noon Buying
Rate as determined in Note 1.
Net sales
Cost of sales
Gross profit
Operating expenses
Selling and advertising
General and administrative
Total
Income from operations
Other income (expenses)
Interest income
Interest expense
Other - net
Other income (expenses) - net
Income before provision
for income taxes
Provision for income taxes
Income before minority
interests in consolidated
subsidiaries
Minority interests in income
of consolidated subsidiaries
Net income
Net income basic
Net income diluted
Weighted average number of shares
outstanding (thousands)
Basic
Diluted
2,852,194
(903,617)
1,948,577
(1,235,757)
(281,033)
(1,516,790)
431,787
5,922
(47,117)
(799)
(41,994)
389,793
(117,328)
272,465
(5,122)
267,343
Euro 0.60
Euro 0.59
448,664.4
450,202.1
2003
(Euro thousands)
3,201,788
(946,134)
2,255,654
(1,360,340)
(293,806)
(1,654,146)
601,508
5,036
(65,935)
(1,167)
(62,066)
539,442
(162,696)
376,746
(4,669)
372,077
Euro 0.82
Euro 0.82
453,174.0
455,353.5
2002
(Euro thousands)
3,255,300
(1,040,697)
2,214,603
(1,376,546)
(345,243)
(1,721,789)
492,814
6,662
(56,115)
13,792
(35,661)
457,153
(161,665)
295,488
(8,614)
286,874
Euro 0.64
Euro 0.64
448,275.0
450,360.9
2004
(Euro thousands)
4,407,025
(1,408,896)
2,998,129
(1,863,568)
(467,390)
(2,330,958)
667,171
9,019
(75,968)
18,672
(48,277)
618,894
(218,862)
400,032
(11,661)
388,371
US$ 0.87
US$ 0.86
2004
(US$ thousands) (1)