LensCrafters 2004 Annual Report Download - page 69
Download and view the complete annual report
Please find page 69 of the 2004 LensCrafters annual report below. You can navigate through the pages in the report by either clicking on the pages listed below, or by using the keyword search tool below to find specific information within the annual report.-
 1
1 -
2
-
3
-
4
-
5
-
6
-
7
-
8
-
9
-
10
-
11
-
12
-
13
-
14
-
15
-
16
-
17
-
18
-
19
-
20
-
21
-
22
-
23
-
24
-
25
-
26
-
27
-
28
-
29
-
30
-
31
-
32
-
33
-
34
-
35
-
36
-
37
-
38
-
39
-
40
-
41
-
42
-
43
-
44
-
45
-
46
-
47
-
48
-
49
-
50
-
51
-
52
-
53
-
54
-
55
-
56
-
57
-
58
-
 59
59 -
 60
60 -
 61
61 -
 62
62 -
 63
63 -
 64
64 -
 65
65 -
 66
66 -
 67
67 -
 68
68 -
 69
69 -
 70
70 -
 71
71 -
 72
72 -
 73
73 -
 74
74 -
 75
75 -
 76
76 -
 77
77 -
 78
78 -
 79
79 -
80
-
81
-
82
-
83
-
84
-
85
-
86
-
87
-
88
-
89
-
90
-
91
-
92
-
93
-
94
-
95
-
96
-
97
-
98
-
99
-
100
-
101
-
102
-
103
-
104
-
105
-
106
-
107
-
108
-
109
-
110
-
111
-
112
-
113
-
114
-
115
-
116
-
117
-
118
-
119
-
120
-
121
-
122
-
123
-
124
-
125
-
126
-
127
-
128
-
129
-
130
-
131
-
132
-
133
-
134
-
135
-
136
-
137
-
138
-
139
-
140
-
141
-
142
-
143
-
144
-
145
-
146
-
147
-
148
-
149
-
150
-
151
-
152
-
153
 |
 |

68
On a consistent basis, including OPSM Group results
for 2003 and Cole National results for the first quarter
of 2003, and eliminating the 53rd week, income from
operations in 2004 over 2003 would have risen 12.7%.
The 12.7% increase was attributable to the increase in
retail sales in North America, partially offset by the
depreciation of the U.S. Dollar, as previously
mentioned.
LIQUIDITY
AND FINANCIAL RESOURCES
Luxottica Group finances regular operations and
commercial expansion primarily through internally
generated funds, trade credits and bank loans. Bank
debt consists of overdrafts and lines of credit opened
by Luxottica Group and certain of its subsidiaries with
local credit institutions. These credit facility
agreements are short term and include automatic
renewal clauses requiring short periods of advance
notification. Some of these agreements require
guarantees by Luxottica Group S.p.A. Interest rates on
these lines of credit vary according to the currency in
which the financing has been secured. Luxottica
Group uses these short-term lines of credit to meet
short-term financial needs.
In order to refinance an existing Eurobond issue, in
June of 2002, Luxottica U.S. Holdings Corp. (“U.S.
Holdings”), a wholly-owned U.S. subsidiary, entered
into a US$ 350 million credit facility agreement with
a group of four Italian banks led by UniCredito
Italiano S.p.A. The credit facility was guaranteed by
Luxottica Group S.p.A. and matures in June 2005.
The term loan portion of the credit facility provided
US$ 200 million, to be repaid in equal, quarterly
principal installments beginning in March 2003. The
revolving loan portion of the credit facility allows for
a maximum borrowing of US$ 150 million, which
may be repaid and renewed until final maturity. This
credit facility allows U.S. Holdings to select interest
periods of one, two or three months. Interest
accrues under the credit facility at LIBOR plus 0.5%
(2.92% for the term loan and 2.917% for the
revolving loan, on December 31, 2004). The credit
facility contains certain financial and operating
covenants; Luxottica Group was compliant with
these covenants as of December 31, 2004. Under
this credit facility, US$ 170 million was outstanding
as of December 31, 2004.
In July 2002, U.S. Holdings entered into a Convertible
Swap Step-Up (“2002 Swap”). The 2002 Swap has
an aggregate maximum notional amount of US$ 275
million which provided for a decrease of US$ 20
million every three months starting March 17, 2003.
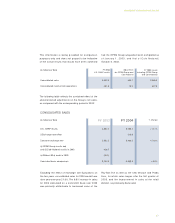
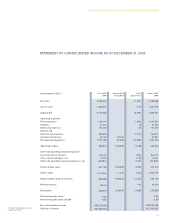
The following table summarizes the impact of the
acquisition of OPSM Group, the acquisition of Cole
National, and the 53rd week on consolidated
income from operations in order to facilitate their
comparison with 2004 on a consistent basis.
U.S. GAAP results
% of sales
ii) OPSM Group results
and iii) Cole National results in 2003
iv) Without 53rd week in 2003
Consistent basis comparison
% of sales
431.8
15.1%
15.2
(9.6)
437.4
13.5%
492.8
15.1%
492.8
14.2%
+ 14.1%
+ 12.7%
In millions of Euro
CONSOLIDATED INCOME FROM OPERATIONS
FY 2004 % change
FY 2003
MANAGEMENT’S DISCUSSION AND ANALYSIS