LensCrafters 2004 Annual Report Download - page 62
Download and view the complete annual report
Please find page 62 of the 2004 LensCrafters annual report below. You can navigate through the pages in the report by either clicking on the pages listed below, or by using the keyword search tool below to find specific information within the annual report.-
 1
1 -
2
-
3
-
4
-
5
-
6
-
7
-
8
-
9
-
10
-
11
-
12
-
13
-
14
-
15
-
16
-
17
-
18
-
19
-
20
-
21
-
22
-
23
-
24
-
25
-
26
-
27
-
28
-
29
-
30
-
31
-
32
-
33
-
34
-
35
-
36
-
37
-
38
-
39
-
40
-
41
-
42
-
43
-
44
-
45
-
46
-
47
-
48
-
49
-
50
-
51
-
 52
52 -
 53
53 -
 54
54 -
 55
55 -
 56
56 -
 57
57 -
 58
58 -
 59
59 -
 60
60 -
 61
61 -
 62
62 -
 63
63 -
 64
64 -
 65
65 -
 66
66 -
 67
67 -
 68
68 -
 69
69 -
 70
70 -
 71
71 -
 72
72 -
73
-
74
-
75
-
76
-
77
-
78
-
79
-
80
-
81
-
82
-
83
-
84
-
85
-
86
-
87
-
88
-
89
-
90
-
91
-
92
-
93
-
94
-
95
-
96
-
97
-
98
-
99
-
100
-
101
-
102
-
103
-
104
-
105
-
106
-
107
-
108
-
109
-
110
-
111
-
112
-
113
-
114
-
115
-
116
-
117
-
118
-
119
-
120
-
121
-
122
-
123
-
124
-
125
-
126
-
127
-
128
-
129
-
130
-
131
-
132
-
133
-
134
-
135
-
136
-
137
-
138
-
139
-
140
-
141
-
142
-
143
-
144
-
145
-
146
-
147
-
148
-
149
-
150
-
151
-
152
-
153
 |
 |

61
ANNUAL REPORT 2004
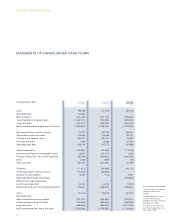
STATEMENTS OF CONSOLIDATED INCOME
(for years ended December 31)
MANAGEMENT’S DISCUSSION
AND ANALYSIS
In accordance with U.S.GAAP
(1) 2001-2004 figures include
results of Sunglass Hut
operations from the acquisition
date (March 31, 2001).
(2) Results for the year ended
December 31, 2002, include the
effect of adoption of Statement
of Financial Accounting
Standard No. 142.
(3) 2003-2004 figures include
results of OPSM Group
operations from the acquisition
date (August 1, 2003).
(4) Figures include results of
Cole National operations from
fourth quarter 2004.
(5) Figures adjusted to allow a
comparison with results for
2003.
Net sales
Cost of sales
Purchases and
inventory variance
Manufacturing cost
Manufacturing
depreciation
Manufacturing
personnel cost
Gross profit
Operating expenses
Selling expenses
Royalties
Advertising expenses
General and
administrative
expenses
Goodwill and
trademark
amortization
Operating income
Other income/
(expenses)
Financial income
Financial charges
Other income and
charges
Income before taxes
Provision for income
taxes
Minority interests
Net income
3,105,498
(923,537)
(527,346)
(115,928)
(26,227)
(254,036)
2,181,960
(1,672,468)
(1,037,113)
(54,556)
(211,728)
(274,873)
(94,198)
509,492
(68,181)
15,060
(91,978)
8,737
441,311
(123,450)
(1,488)
316,373
100.0%
29.7%
17.0%
3.7%
0.8%
8.2%
70.3%
53.9%
33.4%
1.8%
6.8%
8.9%
3.0%
16.4%
2.2%
0.5%
3.0%
0.3%
14.2%
4.0%
0.0%
10.2%
3,201,788
(946,134)
(509,725)
(147,977)
(27,224)
(261,208)
2,255,654
(1,654,146)
(1,087,321)
(62,274)
(210,744)
(257,742)
(36,065)
601,508
(62,066)
5,036
(65,935)
(1,167)
539,442
(162,696)
(4,669)
372,077
100.0%
29.6%
15.9%
4.6%
0.9%
8.2%
70.4%
51.7%
34.0%
1.9%
6.6%
8.0%
1.1%
18.8%
1.9%
0.2%
2.1%
0.0%
16.8%
5.1%
0.1%
11.6%
2,852,194
(903,617)
(506,335)
(134,037)
(22,320)
(240,925)
1,948,577
(1,516,790)
(1,015,918)
(41,537)
(178,303)
(243,717)
(37,316)
431,787
(41,994)
5,922
(47,117)
(799)
389,793
(117,328)
(5,122)
267,343
100.0%
31.7%
17.8%
4.7%
0.8%
8.4%
68.3%
53.2%
35.6%
1.5%
6.3%
8.5%
1.3%
15.1%
1.5%
0.2%
1.7%
0.0%
13.7%
4.1%
0.2%
9.4%
3,255,300
(1,040,697)
(571,038)
(190,041)
(22,742)
(256,876)
2,214,603
(1,721,789)
(1,133,114)
(51,002)
(192,430)
(300,095)
(45,148)
492,814
(35,661)
6,662
(56,115)
13,792
457,153
(161,665)
(8,614)
286,874
100.0%
32.0%
17.5%
5.8%
0.7%
7.9%
68.0%
52.9%
34.8%
1.6%
5.9%
9.2%
1.4%
15.1%
1.1%
0.2%
1.7%
0.4%
14.0%
5.0%
0.3%
8.8%
In thousands of Euro 2001
(1) (5) 2002
(1) (2) (5) 2003
(1) (3) 2004
(1) (3) (4)