LensCrafters 2004 Annual Report Download - page 10
Download and view the complete annual report
Please find page 10 of the 2004 LensCrafters annual report below. You can navigate through the pages in the report by either clicking on the pages listed below, or by using the keyword search tool below to find specific information within the annual report.-
 1
1 -
 2
2 -
 3
3 -
 4
4 -
 5
5 -
 6
6 -
 7
7 -
 8
8 -
 9
9 -
 10
10 -
 11
11 -
 12
12 -
 13
13 -
 14
14 -
 15
15 -
 16
16 -
 17
17 -
 18
18 -
 19
19 -
 20
20 -
 21
21 -
22
-
23
-
24
-
25
-
26
-
27
-
28
-
29
-
30
-
31
-
32
-
33
-
34
-
35
-
36
-
37
-
38
-
39
-
40
-
41
-
42
-
43
-
44
-
45
-
46
-
47
-
48
-
49
-
50
-
51
-
52
-
53
-
54
-
55
-
56
-
57
-
58
-
59
-
60
-
61
-
62
-
63
-
64
-
65
-
66
-
67
-
68
-
69
-
70
-
71
-
72
-
73
-
74
-
75
-
76
-
77
-
78
-
79
-
80
-
81
-
82
-
83
-
84
-
85
-
86
-
87
-
88
-
89
-
90
-
91
-
92
-
93
-
94
-
95
-
96
-
97
-
98
-
99
-
100
-
101
-
102
-
103
-
104
-
105
-
106
-
107
-
108
-
109
-
110
-
111
-
112
-
113
-
114
-
115
-
116
-
117
-
118
-
119
-
120
-
121
-
122
-
123
-
124
-
125
-
126
-
127
-
128
-
129
-
130
-
131
-
132
-
133
-
134
-
135
-
136
-
137
-
138
-
139
-
140
-
141
-
142
-
143
-
144
-
145
-
146
-
147
-
148
-
149
-
150
-
151
-
152
-
153
 |
 |
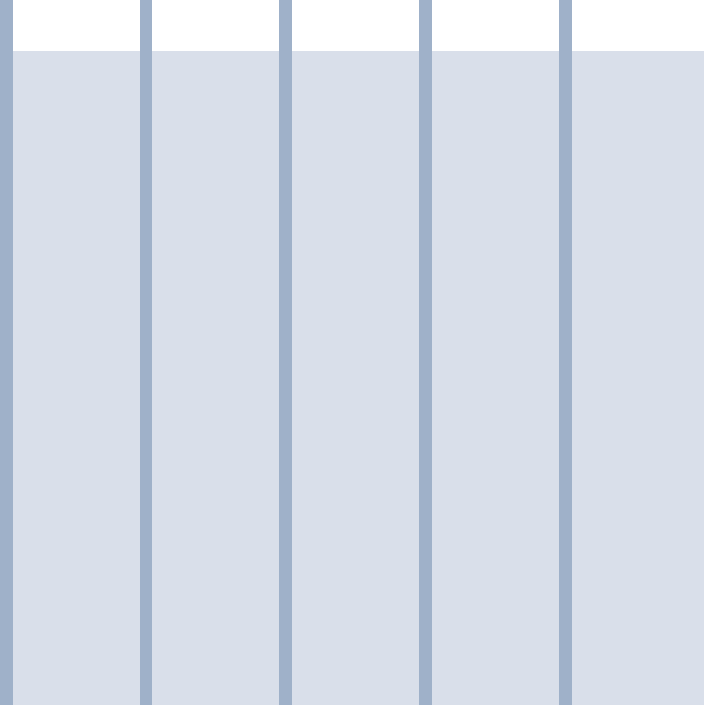
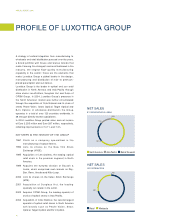
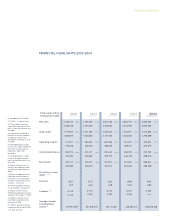
PROFILE OF LUXOTTICA GROUP
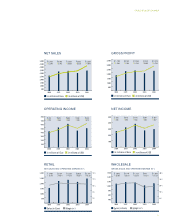
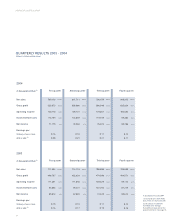
FINANCIAL HIGHLIGHTS 2000-2004
In accordance to U.S GAAP
(1) 1 ADS = 1 ordinary share.
(2) These figures have been
retroactively adjusted to reflect
the 2:1 stock split effective June
26, 2000.
(3) Proposed by the Board of
Directors and to be submitted
for approval at the Annual
Shareholders’ Meeting on June
15, 2005.
(4) 1995-2004 figures include
results of U.S. Shoe (acquired in
May 1995) and Persol S.p.A.
(acquired in April 1995)
operations.
(5) 1999-2004 figures include
results of Ray-Ban operations
from the acquisition date (June
26, 1999).
(6) Figures include results of
Sunglass Hut operations from
the acquisition date (March 31,
2001).
(7) Results for 2000 have been
calculated from the financial
statements in Lire converted at
the fixed exchange rate of Lire
1,936.27 = Euro 1.00.
(8) For the Euro/US$ exchange
rate on dividends, see page 91.
(9) Figures include results of
OPSM Group operations from the
acquisition date (August 1, 2003).
(10) Figures include results of
Cole National operations from
fourth quarter 2004.
(11) Figures adjusted to allow a
comparison with results for 2003.
(*) In Euro and US$
Net sales
Gross profit
Operating income
Income before taxes
Net income
Per ordinary share
(ADS) (1) (2) (*)
Earnings
Dividend (3) (8)
Average number
of outstanding
shares (2)
2,439,166
2,246,228
1,719,925
1,583,879
411,921
379,338
362,019
333,383
255,277
235,085
0.57
0.52
0.140
0.120
100.0%
70.5%
16.9%
14.8%
10.5%
3,105,498
2,781,594
2,181,960
1,954,382
509,492
456,352
441,311
395,282
316,373
283,375
0.70
0.63
0.170
0.165
100.0%
70.3%
16.4%
14.2%
10.2%
3,201,788
3,025,690
2,255,654
2,131,593
601,508
568,425
539,442
509,772
372,077
351,613
0.82
0.78
0.210
0.242
100.0%
70.4%
18.8%
16.8%
11.6%
2,852,194
3,224,976
1,948,577
2,203,256
431,787
488,222
389,793
440,739
267,343
302,285
0.60
0.67
0.210
0.256
100.0%
68.3%
15.1%
13.7%
9.4%
3,255,300
4,047,966
2,214,603
2,753,859
492,814
612,814
457,153
568,470
286,874
356,728
0.64
0.80
0.230
n.a.
100.0%
68.0%
15.1%
14.0%
8.8%
2000
(4) (5) (7) (11) 2001
(4) (5) (6) (11) 2002
(4) (5) (6) (11) 2003
(4) (5) (6) (9) 2004
(4) (5) (6) (9) (10)
449,987,899 451,036,978 453,174,041 448,664,413 448,275,028
9
In thousands of Euro
In thousands of US$