LensCrafters 2004 Annual Report Download - page 96
Download and view the complete annual report
Please find page 96 of the 2004 LensCrafters annual report below. You can navigate through the pages in the report by either clicking on the pages listed below, or by using the keyword search tool below to find specific information within the annual report.-
 1
1 -
2
-
3
-
4
-
5
-
6
-
7
-
8
-
9
-
10
-
11
-
12
-
13
-
14
-
15
-
16
-
17
-
18
-
19
-
20
-
21
-
22
-
23
-
24
-
25
-
26
-
27
-
28
-
29
-
30
-
31
-
32
-
33
-
34
-
35
-
36
-
37
-
38
-
39
-
40
-
41
-
42
-
43
-
44
-
45
-
46
-
47
-
48
-
49
-
50
-
51
-
52
-
53
-
54
-
55
-
56
-
57
-
58
-
59
-
60
-
61
-
62
-
63
-
64
-
65
-
66
-
67
-
68
-
69
-
70
-
71
-
72
-
73
-
74
-
75
-
76
-
77
-
78
-
79
-
80
-
81
-
82
-
83
-
84
-
85
-
 86
86 -
 87
87 -
 88
88 -
 89
89 -
 90
90 -
 91
91 -
 92
92 -
 93
93 -
 94
94 -
 95
95 -
 96
96 -
 97
97 -
 98
98 -
 99
99 -
 100
100 -
 101
101 -
 102
102 -
 103
103 -
 104
104 -
 105
105 -
 106
106 -
107
-
108
-
109
-
110
-
111
-
112
-
113
-
114
-
115
-
116
-
117
-
118
-
119
-
120
-
121
-
122
-
123
-
124
-
125
-
126
-
127
-
128
-
129
-
130
-
131
-
132
-
133
-
134
-
135
-
136
-
137
-
138
-
139
-
140
-
141
-
142
-
143
-
144
-
145
-
146
-
147
-
148
-
149
-
150
-
151
-
152
-
153
 |
 |
INDEPENDENT AUDITORS’ REPORT
95
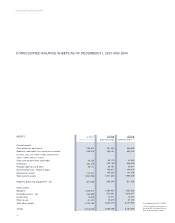
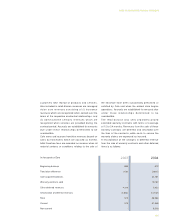
CONSOLIDATED BALANCE SHEETS AS OF DECEMBER 31, 2003 AND 2004
(Continued)
In accordance with U.S. GAAP
(1) Translated for convenience at
the New York City Noon Buying
Rate as determined in Note 1.
Current liabilities
Bank overdrafts
Current portion of long-term debt
Accounts payable
Accrued expenses:
- Payroll and related
- Customers’ right of return
- Other
Income taxes payable
Total current liabilities
Long-term debt
Liability for termination indemnities
Deferred tax liabilities
Other long-term liabilities
Commitments and contingencies
Minority interests in consolidated subsidiaries
Shareholders’ equity
Capital stock
(par value Euro 0.06 - 454,477,033 and 455,205,473
ordinary shares authorized and issued at December 31,
2003 and 2004, respectively 448,042,247
and 448,770,687 shares outstanding at
December 31, 2003 and 2004, respectively)
Additional paid-in capital
Retained earnings
Accumulated other comprehensive loss, net of tax
Total
Less treasury shares at cost
(6,434,786 and 6,434,786 shares
at December 31, 2003 and 2004, respectively)
Shareholders’ equity
TOTAL
LIABILITIES AND SHAREHOLDERS’ EQUITY
516,905
390,935
178,616
77,780
7,423
140,608
11,011
1,323,278
862,492
47,241
161,102
124,157
19,872
27,269
40,423
1,619,312
(242,483)
1,444,521
69,987
1,374,534
3,912,676
2003
(Euro thousands)
290,531
405,369
222,550
137,947
8,802
238,832
12,722
1,316,753
1,277,495
52,656
215,891
173,896
23,760
27,312
47,167
1,812,073
(320,958)
1,565,594
69,987
1,495,607
4,556,058
2004
(Euro thousands)
393,321
548,789
301,288
186,753
11,916
323,331
17,223
1,782,621
1,729,473
71,286
292,273
235,420
32,166
36,975
63,855
2,453,184
(434,513)
2,119,501
94,748
2,024,753
6,167,992
2004
(US$ thousands) (1)