LensCrafters 2004 Annual Report Download - page 63
Download and view the complete annual report
Please find page 63 of the 2004 LensCrafters annual report below. You can navigate through the pages in the report by either clicking on the pages listed below, or by using the keyword search tool below to find specific information within the annual report.-
 1
1 -
2
-
3
-
4
-
5
-
6
-
7
-
8
-
9
-
10
-
11
-
12
-
13
-
14
-
15
-
16
-
17
-
18
-
19
-
20
-
21
-
22
-
23
-
24
-
25
-
26
-
27
-
28
-
29
-
30
-
31
-
32
-
33
-
34
-
35
-
36
-
37
-
38
-
39
-
40
-
41
-
42
-
43
-
44
-
45
-
46
-
47
-
48
-
49
-
50
-
51
-
52
-
 53
53 -
 54
54 -
 55
55 -
 56
56 -
 57
57 -
 58
58 -
 59
59 -
 60
60 -
 61
61 -
 62
62 -
 63
63 -
 64
64 -
 65
65 -
 66
66 -
 67
67 -
 68
68 -
 69
69 -
 70
70 -
 71
71 -
 72
72 -
 73
73 -
74
-
75
-
76
-
77
-
78
-
79
-
80
-
81
-
82
-
83
-
84
-
85
-
86
-
87
-
88
-
89
-
90
-
91
-
92
-
93
-
94
-
95
-
96
-
97
-
98
-
99
-
100
-
101
-
102
-
103
-
104
-
105
-
106
-
107
-
108
-
109
-
110
-
111
-
112
-
113
-
114
-
115
-
116
-
117
-
118
-
119
-
120
-
121
-
122
-
123
-
124
-
125
-
126
-
127
-
128
-
129
-
130
-
131
-
132
-
133
-
134
-
135
-
136
-
137
-
138
-
139
-
140
-
141
-
142
-
143
-
144
-
145
-
146
-
147
-
148
-
149
-
150
-
151
-
152
-
153
 |
 |

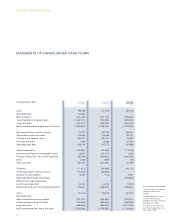
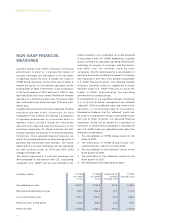
MANAGEMENT’S DISCUSSION AND ANALYSIS
62
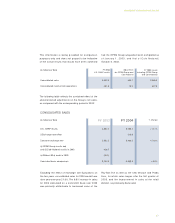
STATEMENTS OF CONSOLIDATED CASH FLOWS
Cash
Restricted cash
Bank overdraft
Current portion of long-term debt
Long-term debt
Net financial position, beginning of the year
Net income before minority interests
Depreciation and amortization
Change in net working capital
Provision and other
Operating cash flow
Capital expenditure
(Investments)/Disposal in intangible assets
Purchase of business net of cash acquired
Other
Free cash flow
Dividends
(Purchases)/Sale of treasury shares
Exercise of stock options
Debt acquired through acquisitions
Effect of exchange adjustments
to net financial position
Decrease/(increase) in net financial position
Cash
Restricted cash
Bank overdraft and notes payable
Current portion of long-term debt
Long-term debt
Net financial position, end of the year
199,202
213,507
(411,193)
(1,339,131)
(132,247)
(1,469,862)
372,077
145,980
(83,427)
1,649
436,279
(173,330)
28,611
(35,039)
4,646
261,167
(77,211)
(15,278)
13,461
-
33,423
215,562
151,418
-
(371,729)
(178,335)
(855,654)
(1,254,300)
151,418
-
(371,729)
(178,335)
(855,654)
(1,254,300)
267,343
134,840
(95,177)
20,266
327,272
(81,288)
(48,177)
(342,933)
3,839
(141,287)
(95,405)
(45,440)
1,743
-
64,294
(216,095)
299,973
-
(516,905)
(390,935)
(862,492)
(1,470,395)
299,973
-
(516,905)
(390,935)
(862,492)
(1,470,395)
286,874
152,751
40,907
47,351
527,883
(117,420)
(301)
(362,978)
198
47,382
(94,113)
-
6,787
(275,952)
70,245
(245,651)
257,349
-
(290,531)
(405,369)
(1,277,495)
(1,716,046)
In thousands of Euro 2002
(1) 2003
(2) 2004
(2) (3)
In accordance with U.S.GAAP
(1) Figures adjusted to allow a
comparison with results
for 2003.
(2) 2003-2004 figures include
results of OPSM Group
operations from the acquisition
date (August 1, 2003).
(3) Figures include results of
Cole National operations from
fourth quarter 2004.