LensCrafters 2004 Annual Report Download - page 9
Download and view the complete annual report
Please find page 9 of the 2004 LensCrafters annual report below. You can navigate through the pages in the report by either clicking on the pages listed below, or by using the keyword search tool below to find specific information within the annual report.-
 1
1 -
 2
2 -
 3
3 -
 4
4 -
 5
5 -
 6
6 -
 7
7 -
 8
8 -
 9
9 -
 10
10 -
 11
11 -
 12
12 -
 13
13 -
 14
14 -
 15
15 -
 16
16 -
 17
17 -
 18
18 -
 19
19 -
 20
20 -
21
-
22
-
23
-
24
-
25
-
26
-
27
-
28
-
29
-
30
-
31
-
32
-
33
-
34
-
35
-
36
-
37
-
38
-
39
-
40
-
41
-
42
-
43
-
44
-
45
-
46
-
47
-
48
-
49
-
50
-
51
-
52
-
53
-
54
-
55
-
56
-
57
-
58
-
59
-
60
-
61
-
62
-
63
-
64
-
65
-
66
-
67
-
68
-
69
-
70
-
71
-
72
-
73
-
74
-
75
-
76
-
77
-
78
-
79
-
80
-
81
-
82
-
83
-
84
-
85
-
86
-
87
-
88
-
89
-
90
-
91
-
92
-
93
-
94
-
95
-
96
-
97
-
98
-
99
-
100
-
101
-
102
-
103
-
104
-
105
-
106
-
107
-
108
-
109
-
110
-
111
-
112
-
113
-
114
-
115
-
116
-
117
-
118
-
119
-
120
-
121
-
122
-
123
-
124
-
125
-
126
-
127
-
128
-
129
-
130
-
131
-
132
-
133
-
134
-
135
-
136
-
137
-
138
-
139
-
140
-
141
-
142
-
143
-
144
-
145
-
146
-
147
-
148
-
149
-
150
-
151
-
152
-
153
 |
 |

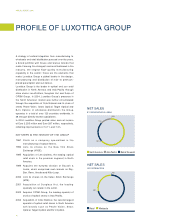
PROFILE OF LUXOTTICA GROUP
8
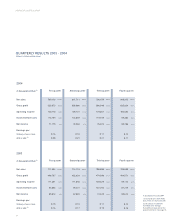
QUARTERLY RESULTS 2003 - 2004
(Subject to limited auditing review)
In accordance to U.S GAAP
(1) Except for per share (ADS)
data, which is in Euro and US$.
(2) All amounts in US$ were
translated at the average
Euro/US$ exchange rate for the
period in reference. See page 91.
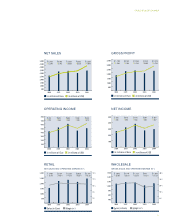
Net sales
Gross profit
Operating income
Income before taxes
Net income
Earnings per:
Ordinary share in Euro
ADS in US$ (2)
769,118
525,073
120,110
113,759
71,175
0.16
0.20
100.0%
68.3%
15.6%
14.8%
9.3%
In thousands of Euro (1) First quarter
811,711
556,866
139,127
124,849
78,968
0.18
0.21
100.0%
68.6%
17.1%
15.4%
9.7%
Second quarter
2004
2003
726,159
506,840
129,051
119,159
76,975
0.17
0.21
100.0%
69.8%
17.8%
16.4%
10.6%
Third quarter
948,312
625,824
104,526
99,386
59,756
0.13
0.17
100.0%
66.0%
11.0%
10.5%
6.3%
Fourth quarter
Net sales
Gross profit
Operating income
Income before taxes
Net income
Earnings per:
Ordinary share in Euro
ADS in US$ (2)
711,494
496,787
111,351
95,853
65,614
0.15
0.16
100.0%
69.8%
15.7%
13.5%
9.2%
In thousands of Euro (1) First quarter
714,115
482,634
111,893
99,427
67,669
0.15
0.17
100.0%
67.6%
15.7%
13.9%
9.5%
Second quarter
700,896
474,586
109,429
107,295
74,449
0.17
0.19
100.0%
67.7%
15.6%
15.3%
10.6%
Third quarter
725,690
494,571
99,114
87,219
59,613
0.13
0.16
100.0%
68.2%
13.7%
12.0%
8.2%
Fourth quarter