LensCrafters 2004 Annual Report Download - page 68
Download and view the complete annual report
Please find page 68 of the 2004 LensCrafters annual report below. You can navigate through the pages in the report by either clicking on the pages listed below, or by using the keyword search tool below to find specific information within the annual report.-
 1
1 -
2
-
3
-
4
-
5
-
6
-
7
-
8
-
9
-
10
-
11
-
12
-
13
-
14
-
15
-
16
-
17
-
18
-
19
-
20
-
21
-
22
-
23
-
24
-
25
-
26
-
27
-
28
-
29
-
30
-
31
-
32
-
33
-
34
-
35
-
36
-
37
-
38
-
39
-
40
-
41
-
42
-
43
-
44
-
45
-
46
-
47
-
48
-
49
-
50
-
51
-
52
-
53
-
54
-
55
-
56
-
57
-
 58
58 -
 59
59 -
 60
60 -
 61
61 -
 62
62 -
 63
63 -
 64
64 -
 65
65 -
 66
66 -
 67
67 -
 68
68 -
 69
69 -
 70
70 -
 71
71 -
 72
72 -
 73
73 -
 74
74 -
 75
75 -
 76
76 -
 77
77 -
 78
78 -
79
-
80
-
81
-
82
-
83
-
84
-
85
-
86
-
87
-
88
-
89
-
90
-
91
-
92
-
93
-
94
-
95
-
96
-
97
-
98
-
99
-
100
-
101
-
102
-
103
-
104
-
105
-
106
-
107
-
108
-
109
-
110
-
111
-
112
-
113
-
114
-
115
-
116
-
117
-
118
-
119
-
120
-
121
-
122
-
123
-
124
-
125
-
126
-
127
-
128
-
129
-
130
-
131
-
132
-
133
-
134
-
135
-
136
-
137
-
138
-
139
-
140
-
141
-
142
-
143
-
144
-
145
-
146
-
147
-
148
-
149
-
150
-
151
-
152
-
153
 |
 |

67
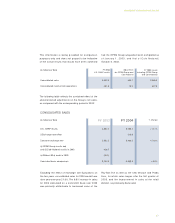
Excluding the effect of exchange rate fluctuations on
the two years, consolidated sales for 2004 would have
risen year-over-year 21.6%. The 6.9% increase in sales
for 2004 calculated on a consistent basis over 2003
was primarily attributable to increased sales of the
Ray-Ban line as well as the new Versace and Prada
lines, for which sales began after the first quarter of
2003, and the improvement in sales at the retail
division, as previously discussed.
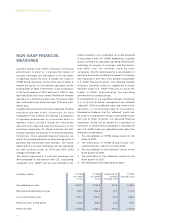
MANAGEMENT’S DISCUSSION AND ANALYSIS
This information is being provided for comparison
purposes only and does not purport to be indicative
of the actual results that would have been achieved
had the OPSM Group acquisition been completed as
of January 1, 2003, and that of Cole National,
October 4, 2003.
Consolidated sales
Consolidated income from operations
2,852.2
431.8
428.7
15.2
3,280.9
447.0
In millions of Euro Adjustment
for OPSM Group and
Cole National
FY 2003 results
including OPSM Group
and Cole National
FY 2003
U.S. GAAP results
The following table reflects the combined effect of the
aforementioned adjustments on the Group’s net sales,
as compared with the corresponding period in 2003:
U.S. GAAP results
i) Exchange rate effect
Constant exchange rate
ii) OPSM Group results and
and iii) Cole National results in 2003
iv) Without 53rd week in 2003
Consistent basis comparison
2,852.2
2,852.2
428.7
(36.9)
3,244.0
3,255.3
213.0
3,468.3
3,468.3
+ 14.1%
+ 21.6%
+ 6.9%
In millions of Euro
CONSOLIDATED SALES
FY 2004 % change
FY 2003