LensCrafters 2004 Annual Report Download - page 91
Download and view the complete annual report
Please find page 91 of the 2004 LensCrafters annual report below. You can navigate through the pages in the report by either clicking on the pages listed below, or by using the keyword search tool below to find specific information within the annual report.-
 1
1 -
2
-
3
-
4
-
5
-
6
-
7
-
8
-
9
-
10
-
11
-
12
-
13
-
14
-
15
-
16
-
17
-
18
-
19
-
20
-
21
-
22
-
23
-
24
-
25
-
26
-
27
-
28
-
29
-
30
-
31
-
32
-
33
-
34
-
35
-
36
-
37
-
38
-
39
-
40
-
41
-
42
-
43
-
44
-
45
-
46
-
47
-
48
-
49
-
50
-
51
-
52
-
53
-
54
-
55
-
56
-
57
-
58
-
59
-
60
-
61
-
62
-
63
-
64
-
65
-
66
-
67
-
68
-
69
-
70
-
71
-
72
-
73
-
74
-
75
-
76
-
77
-
78
-
79
-
80
-
 81
81 -
 82
82 -
 83
83 -
 84
84 -
 85
85 -
 86
86 -
 87
87 -
 88
88 -
 89
89 -
 90
90 -
 91
91 -
 92
92 -
 93
93 -
 94
94 -
 95
95 -
 96
96 -
 97
97 -
 98
98 -
 99
99 -
 100
100 -
 101
101 -
102
-
103
-
104
-
105
-
106
-
107
-
108
-
109
-
110
-
111
-
112
-
113
-
114
-
115
-
116
-
117
-
118
-
119
-
120
-
121
-
122
-
123
-
124
-
125
-
126
-
127
-
128
-
129
-
130
-
131
-
132
-
133
-
134
-
135
-
136
-
137
-
138
-
139
-
140
-
141
-
142
-
143
-
144
-
145
-
146
-
147
-
148
-
149
-
150
-
151
-
152
-
153
 |
 |
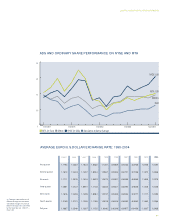
LUXOTTICA GROUP CAPITAL STOCK INFORMATION
90
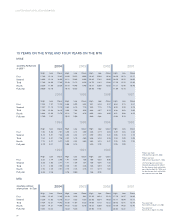
High Low Close
17.85 15.18 15.82
16.90 15.18 16.90
17.85 16.30 17.85
20.39 17.99 20.39
20.39 15.18
2000
High Low Close
12.34 7.97 12.25
12.97 11.19 12.19
17.00 12.38 16.13
16.44 13.00 13.75
17.00 7.97
1996
High Low Close
7.83 5.63 7.81
8.10 6.91 7.34
7.64 6.51 7.28
7.23 5.21 5.21
8.10 5.21
1992
High Low Close
3.23 2.74 2.90
3.28 2.63 2.71
3.11 2.66 2.95
2.93 2.25 2.51
3.28 2.25
First
Second
Third
Fourth
Full year
First
Second
Third
Fourth
Full year
First
Second
Third
Fourth
Full year
First
Second
Third
Fourth
Full year
High Low Close
14.05 10.23 10.95
14.11 10.69 13.90
15.48 13.73 14.29
18.15 14.40 17.40
18.15 10.23
1999
High Low Close
6.66 5.00 6.44
8.63 6.19 7.78
9.53 7.00 9.53
10.31 7.81 8.78
10.31 5.00
1995
High Low Close
3.96 3.13 3.60
3.83 3.43 3.71
4.92 3.70 4.89
5.95 4.54 5.85
5.95 3.13
1991
High Low Close
1.41 0.99 1.38
1.71 1.39 1.51
2.28 1.51 2.26
2.75 2.25 2.75
2.75 0.99
High Low Close
19.82 15.90 19.38
20.85 17.85 19.00
18.70 11.82 12.88
15.51 12.00 13.65
20.85 11.82
1998
High Low Close
9.41 6.28 9.37
9.49 7.75 7.75
8.66 4.97 5.19
6.00 3.88 6.00
9.49 3.88
1994
High Low Close
3.38 2.79 3.04
3.50 2.98 3.41
3.58 3.28 3.39
3.65 3.23 3.41
3.65 2.79
1990
High Low Close
1.06 0.95 0.98
1.38 0.96 1.32
1.46 0.99 1.01
1.11 0.79 1.02
1.46 0.79
High Low Close
16.09 13.13 15.17
16.00 13.25 16.00
17.99 12.15 13.99
17.21 13.45 16.48
17.99 12.15
1997
High Low Close
6.64 5.13 5.31
6.99 5.30 6.78
6.98 5.63 5.69
6.51 5.68 6.25
6.99 5.13
1993
High Low Close
2.49 2.03 2.38
2.56 2.18 2.18
2.38 2.09 2.09
2.95 2.06 2.93
2.95 2.03
Quarterly ADS prices
In US$ (1) 2004 2003 2002 2001
15 YEARS ON THE NYSE AND FOUR YEARS ON THE MTA
NYSE
High Low Close
14.08 12.42 12.80
13.99 12.82 13.70
14.54 13.31 14.42
15.51 14.31 14.99
15.51 12.42
First
Second
Third
Fourth
Full year
High Low Close
13.48 9.25 9.81
12.37 9.85 11.92
13.96 11.67 12.23
14.82 12.35 13.70
14.82 9.25
High Low Close
22.95 18.34 22.43
22.88 18.54 19.69
19.05 11.75 13.22
15.52 12.00 12.58
22.95 11.75
High Low Close
17.20 14.37 16.80
19.11 15.04 19.11
20.62 13.41 15.74
19.59 14.88 18.43
20.62 13.41
Quarterly ordinary
share prices - In Euro 2004 2003 2002 2001
MTA
Fifteen-year high:
US$ 20.85 on April 26, 2002.
Fifteen-year low:
US$ 0.79 on November 7, 1990.
(1) These figures have been
retroactively adjusted to reflect
the five-for-one stock split which
was effective April 16, 1998, and
the two-for-one stock split which
was effective June 26, 2000.
Four-year high:
Euro 22.95 on March 27, 2002.
Four-year low:
Euro 9.25 on March 12, 2003.