LensCrafters 2004 Annual Report Download - page 100
Download and view the complete annual report
Please find page 100 of the 2004 LensCrafters annual report below. You can navigate through the pages in the report by either clicking on the pages listed below, or by using the keyword search tool below to find specific information within the annual report.-
 1
1 -
2
-
3
-
4
-
5
-
6
-
7
-
8
-
9
-
10
-
11
-
12
-
13
-
14
-
15
-
16
-
17
-
18
-
19
-
20
-
21
-
22
-
23
-
24
-
25
-
26
-
27
-
28
-
29
-
30
-
31
-
32
-
33
-
34
-
35
-
36
-
37
-
38
-
39
-
40
-
41
-
42
-
43
-
44
-
45
-
46
-
47
-
48
-
49
-
50
-
51
-
52
-
53
-
54
-
55
-
56
-
57
-
58
-
59
-
60
-
61
-
62
-
63
-
64
-
65
-
66
-
67
-
68
-
69
-
70
-
71
-
72
-
73
-
74
-
75
-
76
-
77
-
78
-
79
-
80
-
81
-
82
-
83
-
84
-
85
-
86
-
87
-
88
-
89
-
 90
90 -
 91
91 -
 92
92 -
 93
93 -
 94
94 -
 95
95 -
 96
96 -
 97
97 -
 98
98 -
 99
99 -
 100
100 -
 101
101 -
 102
102 -
 103
103 -
 104
104 -
 105
105 -
 106
106 -
 107
107 -
 108
108 -
 109
109 -
 110
110 -
111
-
112
-
113
-
114
-
115
-
116
-
117
-
118
-
119
-
120
-
121
-
122
-
123
-
124
-
125
-
126
-
127
-
128
-
129
-
130
-
131
-
132
-
133
-
134
-
135
-
136
-
137
-
138
-
139
-
140
-
141
-
142
-
143
-
144
-
145
-
146
-
147
-
148
-
149
-
150
-
151
-
152
-
153
 |
 |

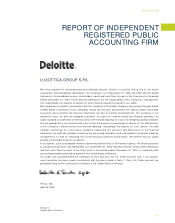
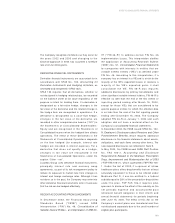
INDEPENDENT AUDITORS’ REPORT
99
In accordance with U.S. GAAP
(1) Translated for convenience at
the New York City Noon Buying
Rate as determined in Note 1.
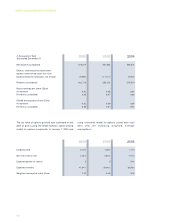
STATEMENTS OF CONSOLIDATED CASH FLOWS FOR THE YEARS ENDED
DECEMBER 31, 2002, 2003 AND 2004
(Continued)
Cash flows from financing activities
Long-term debt:
- Proceeds
- Repayments
Use of restricted cash deposit
(Decrease) increase overdraft
balances
Sales of treasury shares
Investment in treasury shares
Exercise of stock options, including
tax benefit
Dividends
Cash (used in) provided by financing
activities
(Decrease) increase in cash and
cash equivalents
Cash and equivalents, beginning of
year
Effect of exchange rate changes on
cash and cash equivalents
Cash and equivalents, end of year
Supplemental disclosure of cash
flows information
Cash paid during the year
for interest
Cash paid during the year
for income taxes
Acquisition of businesses:
Fair value of assets acquired
619,859
(332,045)
-
156,290
-
(45,440)
1,743
(95,405)
305,002
163,715
151,418
(15,196)
299,937
44,951
110,609
102,323
2003
(Euro thousands)
1,000,714
(1,408,308)
201,106
(21,712)
9,269
(24,547)
13,461
(77,211)
(307,228)
(46,061)
199,202
(1,723)
151,418
58,162
137,650
-
2002
(Euro thousands)
1,187,601
(935,443)
-
(246,680)
-
-
6,787
(94,113)
(81,848)
(34,466)
299,937
(8,122)
257,349
58,371
108,440
157,905
2004
(Euro thousands)
1,607,774
(1,266,403)
-
(333,955)
-
-
9,188
(127,410)
(110,806)
(46,660)
406,055
(10,996)
348,399
79,023
146,806
213,772
2004
(US$ thousands) (1)