LensCrafters 2004 Annual Report Download - page 140
Download and view the complete annual report
Please find page 140 of the 2004 LensCrafters annual report below. You can navigate through the pages in the report by either clicking on the pages listed below, or by using the keyword search tool below to find specific information within the annual report.-
 1
1 -
2
-
3
-
4
-
5
-
6
-
7
-
8
-
9
-
10
-
11
-
12
-
13
-
14
-
15
-
16
-
17
-
18
-
19
-
20
-
21
-
22
-
23
-
24
-
25
-
26
-
27
-
28
-
29
-
30
-
31
-
32
-
33
-
34
-
35
-
36
-
37
-
38
-
39
-
40
-
41
-
42
-
43
-
44
-
45
-
46
-
47
-
48
-
49
-
50
-
51
-
52
-
53
-
54
-
55
-
56
-
57
-
58
-
59
-
60
-
61
-
62
-
63
-
64
-
65
-
66
-
67
-
68
-
69
-
70
-
71
-
72
-
73
-
74
-
75
-
76
-
77
-
78
-
79
-
80
-
81
-
82
-
83
-
84
-
85
-
86
-
87
-
88
-
89
-
90
-
91
-
92
-
93
-
94
-
95
-
96
-
97
-
98
-
99
-
100
-
101
-
102
-
103
-
104
-
105
-
106
-
107
-
108
-
109
-
110
-
111
-
112
-
113
-
114
-
115
-
116
-
117
-
118
-
119
-
120
-
121
-
122
-
123
-
124
-
125
-
126
-
127
-
128
-
129
-
 130
130 -
 131
131 -
 132
132 -
 133
133 -
 134
134 -
 135
135 -
 136
136 -
 137
137 -
 138
138 -
 139
139 -
 140
140 -
 141
141 -
 142
142 -
 143
143 -
 144
144 -
 145
145 -
 146
146 -
 147
147 -
 148
148 -
 149
149 -
 150
150 -
151
-
152
-
153
 |
 |
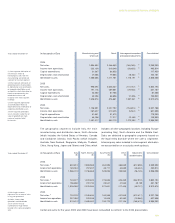
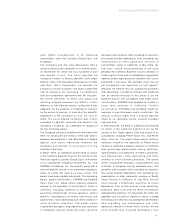
NOTES TO CONSOLIDATED FINANCIAL STATEMENTS
139
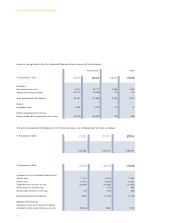
2004
Net sales
Income from operations
Capital expenditures
Depreciation and amortization
Identifiable assets
2003
Net sales
Income from operations
Capital expenditures
Depreciation and amortization
Identifiable assets
2002
Net sales
Income from operations
Capital expenditures
Depreciation and amortization
Identifiable assets
In thousands of Euro
2,346,683
310,340
86,053
79,563
1,211,781
2,028,237
269,851
57,708
68,606
876,661
2,227,702
319,425
91,679
77,217
882,113
Retail
1,094,802
233,129
31,367
47,656
1,566,086
996,694
191,116
23,580
45,208
1,528,074
1,128,901
287,627
81,651
46,298
1,431,317
Manufacturing and
wholesale
(186,185) (1)
(50,655) (2)
25,532 (3)
1,778,191 (4)
(172,737) (1)
(29,180) (2)
-
21,026 (3)
1,507,941 (4)
(154,815) (1)
(5,544) (2)
-
22,465 (3)
1,272,902 (4)
Inter-segment transactions
and corporate adjustments
3,255,300
492,814
117,420
152,751
4,556,058
2,852,194
431,787
81,288
134,840
3,912,676
3,201,788
601,508
173,330
145,980
3,586,332
Consolidated
Years ended December 31
(1) Inter-segment elimination of
net revenues relates to
intercompany sales from the
manufacturing and wholesale
segment to the retail segment.
(2) Inter-segment elimination of
operating income mainly relates
to depreciation and amortization
of corporate identifiable assets
and profit-in-stock elimination for
frames manufactured by the
wholesale business and
included in the retail segment
inventory.
(3) Inter-segment depreciation
and amortization relates to
depreciation and amortization of
corporate identifiable assets.
(4) Inter-segment identifiable
assets includes mainly the net
value of goodwill and trade
names of acquired retail
businesses.
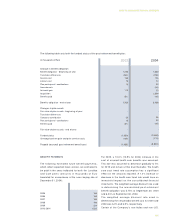
The geographic segments include Italy, the main
manufacturing and distribution base, North America
(which includes the United States of America, Canada
and Caribbean islands), Asia Pacific (which includes
Australia, New Zealand, Singapore, Malaysia, Thailand,
China, Hong Kong, Japan and Taiwan) and Other, which
includes all other geographic locations including Europe
(excluding Italy), South America and the Middle East.
Sales are attributed to geographic segments based on
the legal entity domicile where the sale is originated.
Intercompany sales included in inter-segment elimination
are accounted for on a cost plus mark-up basis.
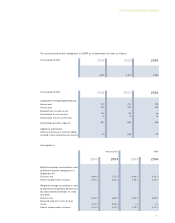
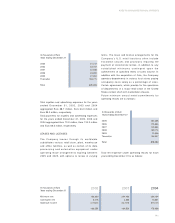
2004
Net sales (5)
Income from operations
Identifiable assets
2003
Net sales (5)
Income from operations
Identifiable assets
2002
Net sales (5)
Income from operations
Identifiable assets
In thousands of Euro
832,813
189,944
1,086,274
743,327
106,808
1,095,350
792,370
207,250
974,412
Italy
(6)
2,083,560
257,897
2,736,868
1,949,692
222,733
2,075,904
2,345,834
323,038
2,405,462
North America
(6)
464,905
40,717
549,096
276,626
20,541
572,691
185,956
19,826
153,779
Asia Pacific
(6)
486,630
44,690
239,965
445,459
41,555
217,458
491,045
62,362
221,154
Other
(6)
(612,608)
(40,434)
(56,145)
(562,910)
40,150
(48,727)
(613,417)
(10,968)
(168,475)
Adjustments
and eliminations
3,255,300
492,814
4,556,058
2,852,194
431,787
3,912,676
3,201,788
601,508
3,586,332
Consolidated
Years ended December 31
(5) No single customer
represents 5% or more of sales
in any year presented.
(6) Sales, income from
operations and identifiable
assets are the result of
combination of legal entities
located in the same geographic
area. Certain amounts for the years 2002 and 2003 have been reclassified to conform to the 2004 presentation.