LensCrafters 2004 Annual Report Download - page 8
Download and view the complete annual report
Please find page 8 of the 2004 LensCrafters annual report below. You can navigate through the pages in the report by either clicking on the pages listed below, or by using the keyword search tool below to find specific information within the annual report.-
 1
1 -
 2
2 -
 3
3 -
 4
4 -
 5
5 -
 6
6 -
 7
7 -
 8
8 -
 9
9 -
 10
10 -
 11
11 -
 12
12 -
 13
13 -
 14
14 -
 15
15 -
 16
16 -
 17
17 -
 18
18 -
 19
19 -
20
-
21
-
22
-
23
-
24
-
25
-
26
-
27
-
28
-
29
-
30
-
31
-
32
-
33
-
34
-
35
-
36
-
37
-
38
-
39
-
40
-
41
-
42
-
43
-
44
-
45
-
46
-
47
-
48
-
49
-
50
-
51
-
52
-
53
-
54
-
55
-
56
-
57
-
58
-
59
-
60
-
61
-
62
-
63
-
64
-
65
-
66
-
67
-
68
-
69
-
70
-
71
-
72
-
73
-
74
-
75
-
76
-
77
-
78
-
79
-
80
-
81
-
82
-
83
-
84
-
85
-
86
-
87
-
88
-
89
-
90
-
91
-
92
-
93
-
94
-
95
-
96
-
97
-
98
-
99
-
100
-
101
-
102
-
103
-
104
-
105
-
106
-
107
-
108
-
109
-
110
-
111
-
112
-
113
-
114
-
115
-
116
-
117
-
118
-
119
-
120
-
121
-
122
-
123
-
124
-
125
-
126
-
127
-
128
-
129
-
130
-
131
-
132
-
133
-
134
-
135
-
136
-
137
-
138
-
139
-
140
-
141
-
142
-
143
-
144
-
145
-
146
-
147
-
148
-
149
-
150
-
151
-
152
-
153
 |
 |
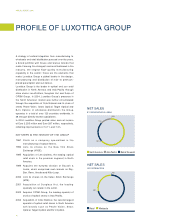
PROFILE OF LUXOTTICA GROUP
7
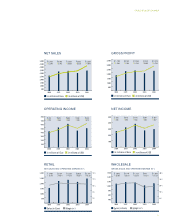
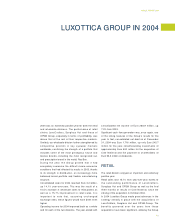
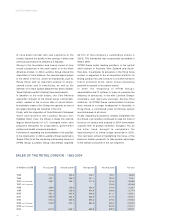
NET SALES GROSS PROFIT
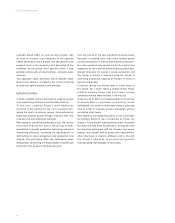
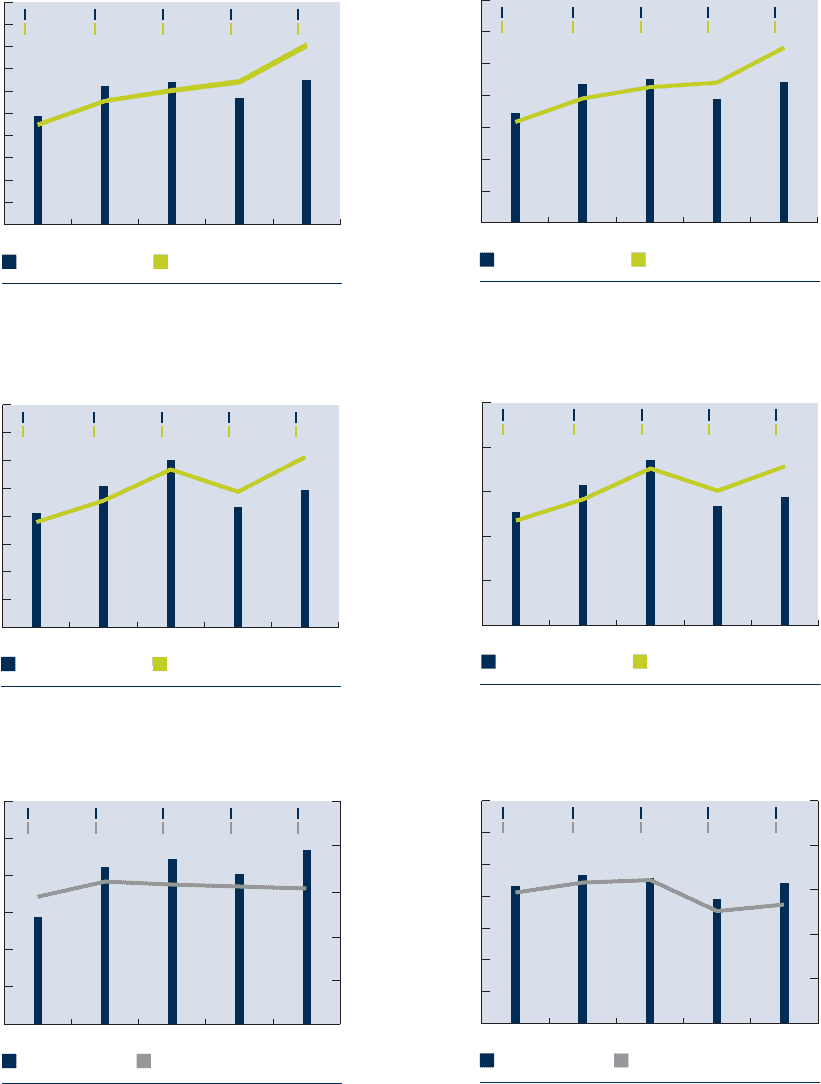
OPERATING INCOME NET INCOME
in millions of US$
500
1,000
1,500
2,000
2,500
3,000
3,500
4,000
4,500
5,000
20042003200220012000
2,439 3,105 3,202 2,852 3,255
2,246 2,782 3,026 3,225 4,048
in millions of Euro
100
200
300
400
500
600
700
800
20042003200220012000
412 509 602 432 493
379 456 569 488 613
in millions of US$
in millions of Euro
500
1,000
1,500
2,000
2,500
3,000
3,500
20042003200220012000
1,720 2,182 2,256 1,949 2,215
1,584 1,954 2,132 2,203 2,754
in millions of US$
in millions of Euro
100
200
300
400
500
20042003200220012000
255 316 372 267 287
235 283 352 302 357
in millions of US$
in millions of Euro
Sales (in Euro) Margin in %
1,500
1,000
2,000
2,500
3,000
20042003200220012000
5%
13%
17%
19%
1,468 2,154 2,228 2,028 2,347
12.7% 14.9% 14.3% 13.3% 13.2%
9%
500
RETAIL
NET SALES AND OPERATING MARGIN IN %
Sales (in Euro) Margin in %
600
800
1,000
1,200
1,400
20042003200220012000
1,076 1,147 1,129 997 1,095
23.6% 25.1% 25.5% 19.2% 21.3%
16%
24%
32%
40%
1,600
400 8%
WHOLESALE
GROSS SALES AND OPERATING MARGIN IN %